- Researchers have developed a new dataset that shows global drivers of deforestation at a one-kilometre spatial resolution.
- For Asia, the analysis reveals that wildfires were the dominant drivers at 65.4% followed by logging at 26.3% and permanent agriculture at 2.5%.
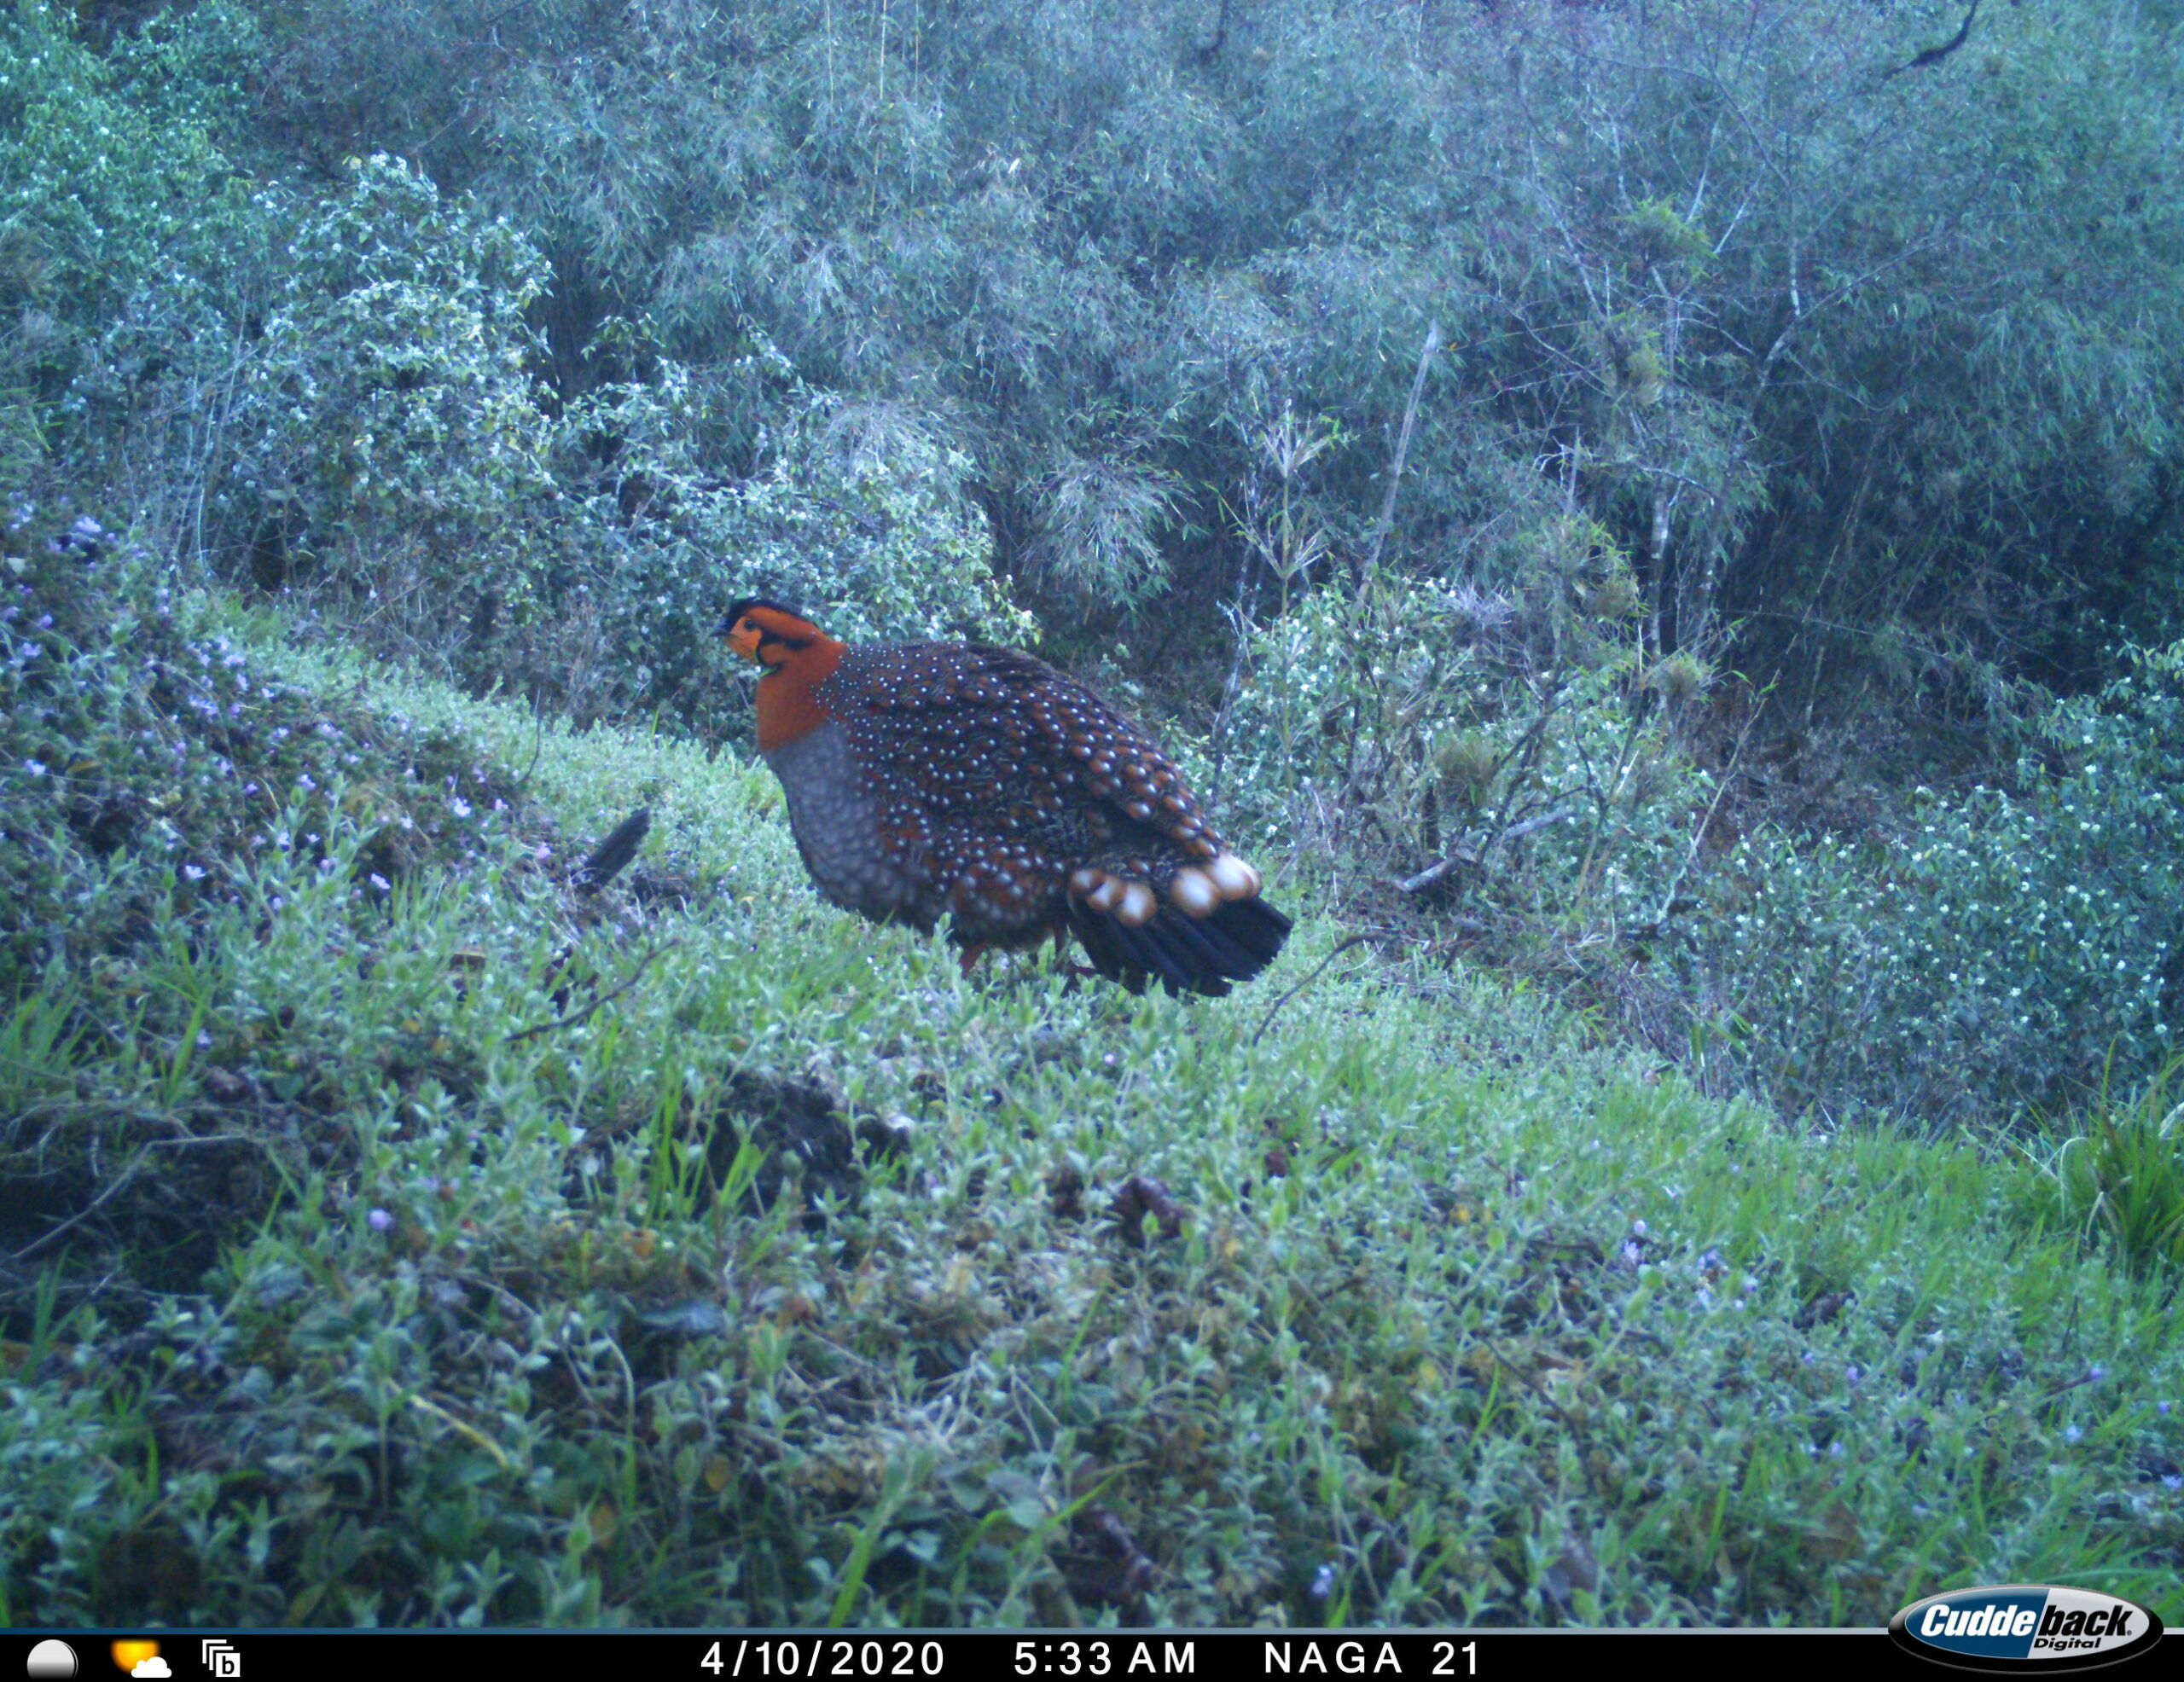
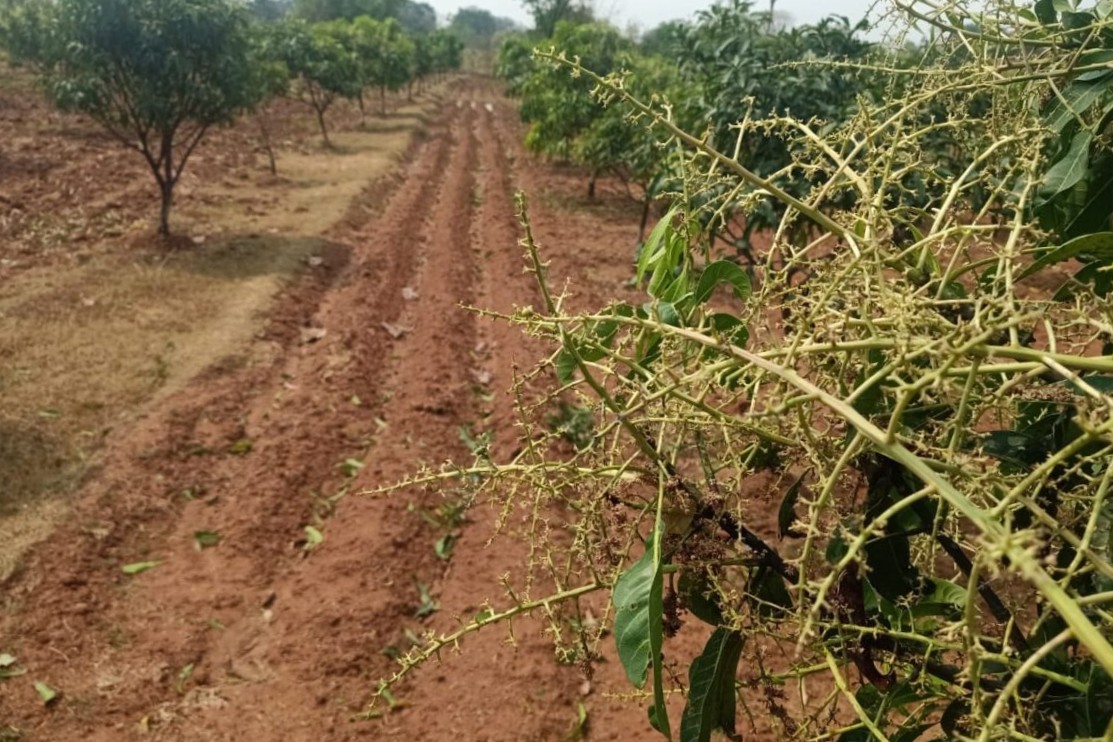
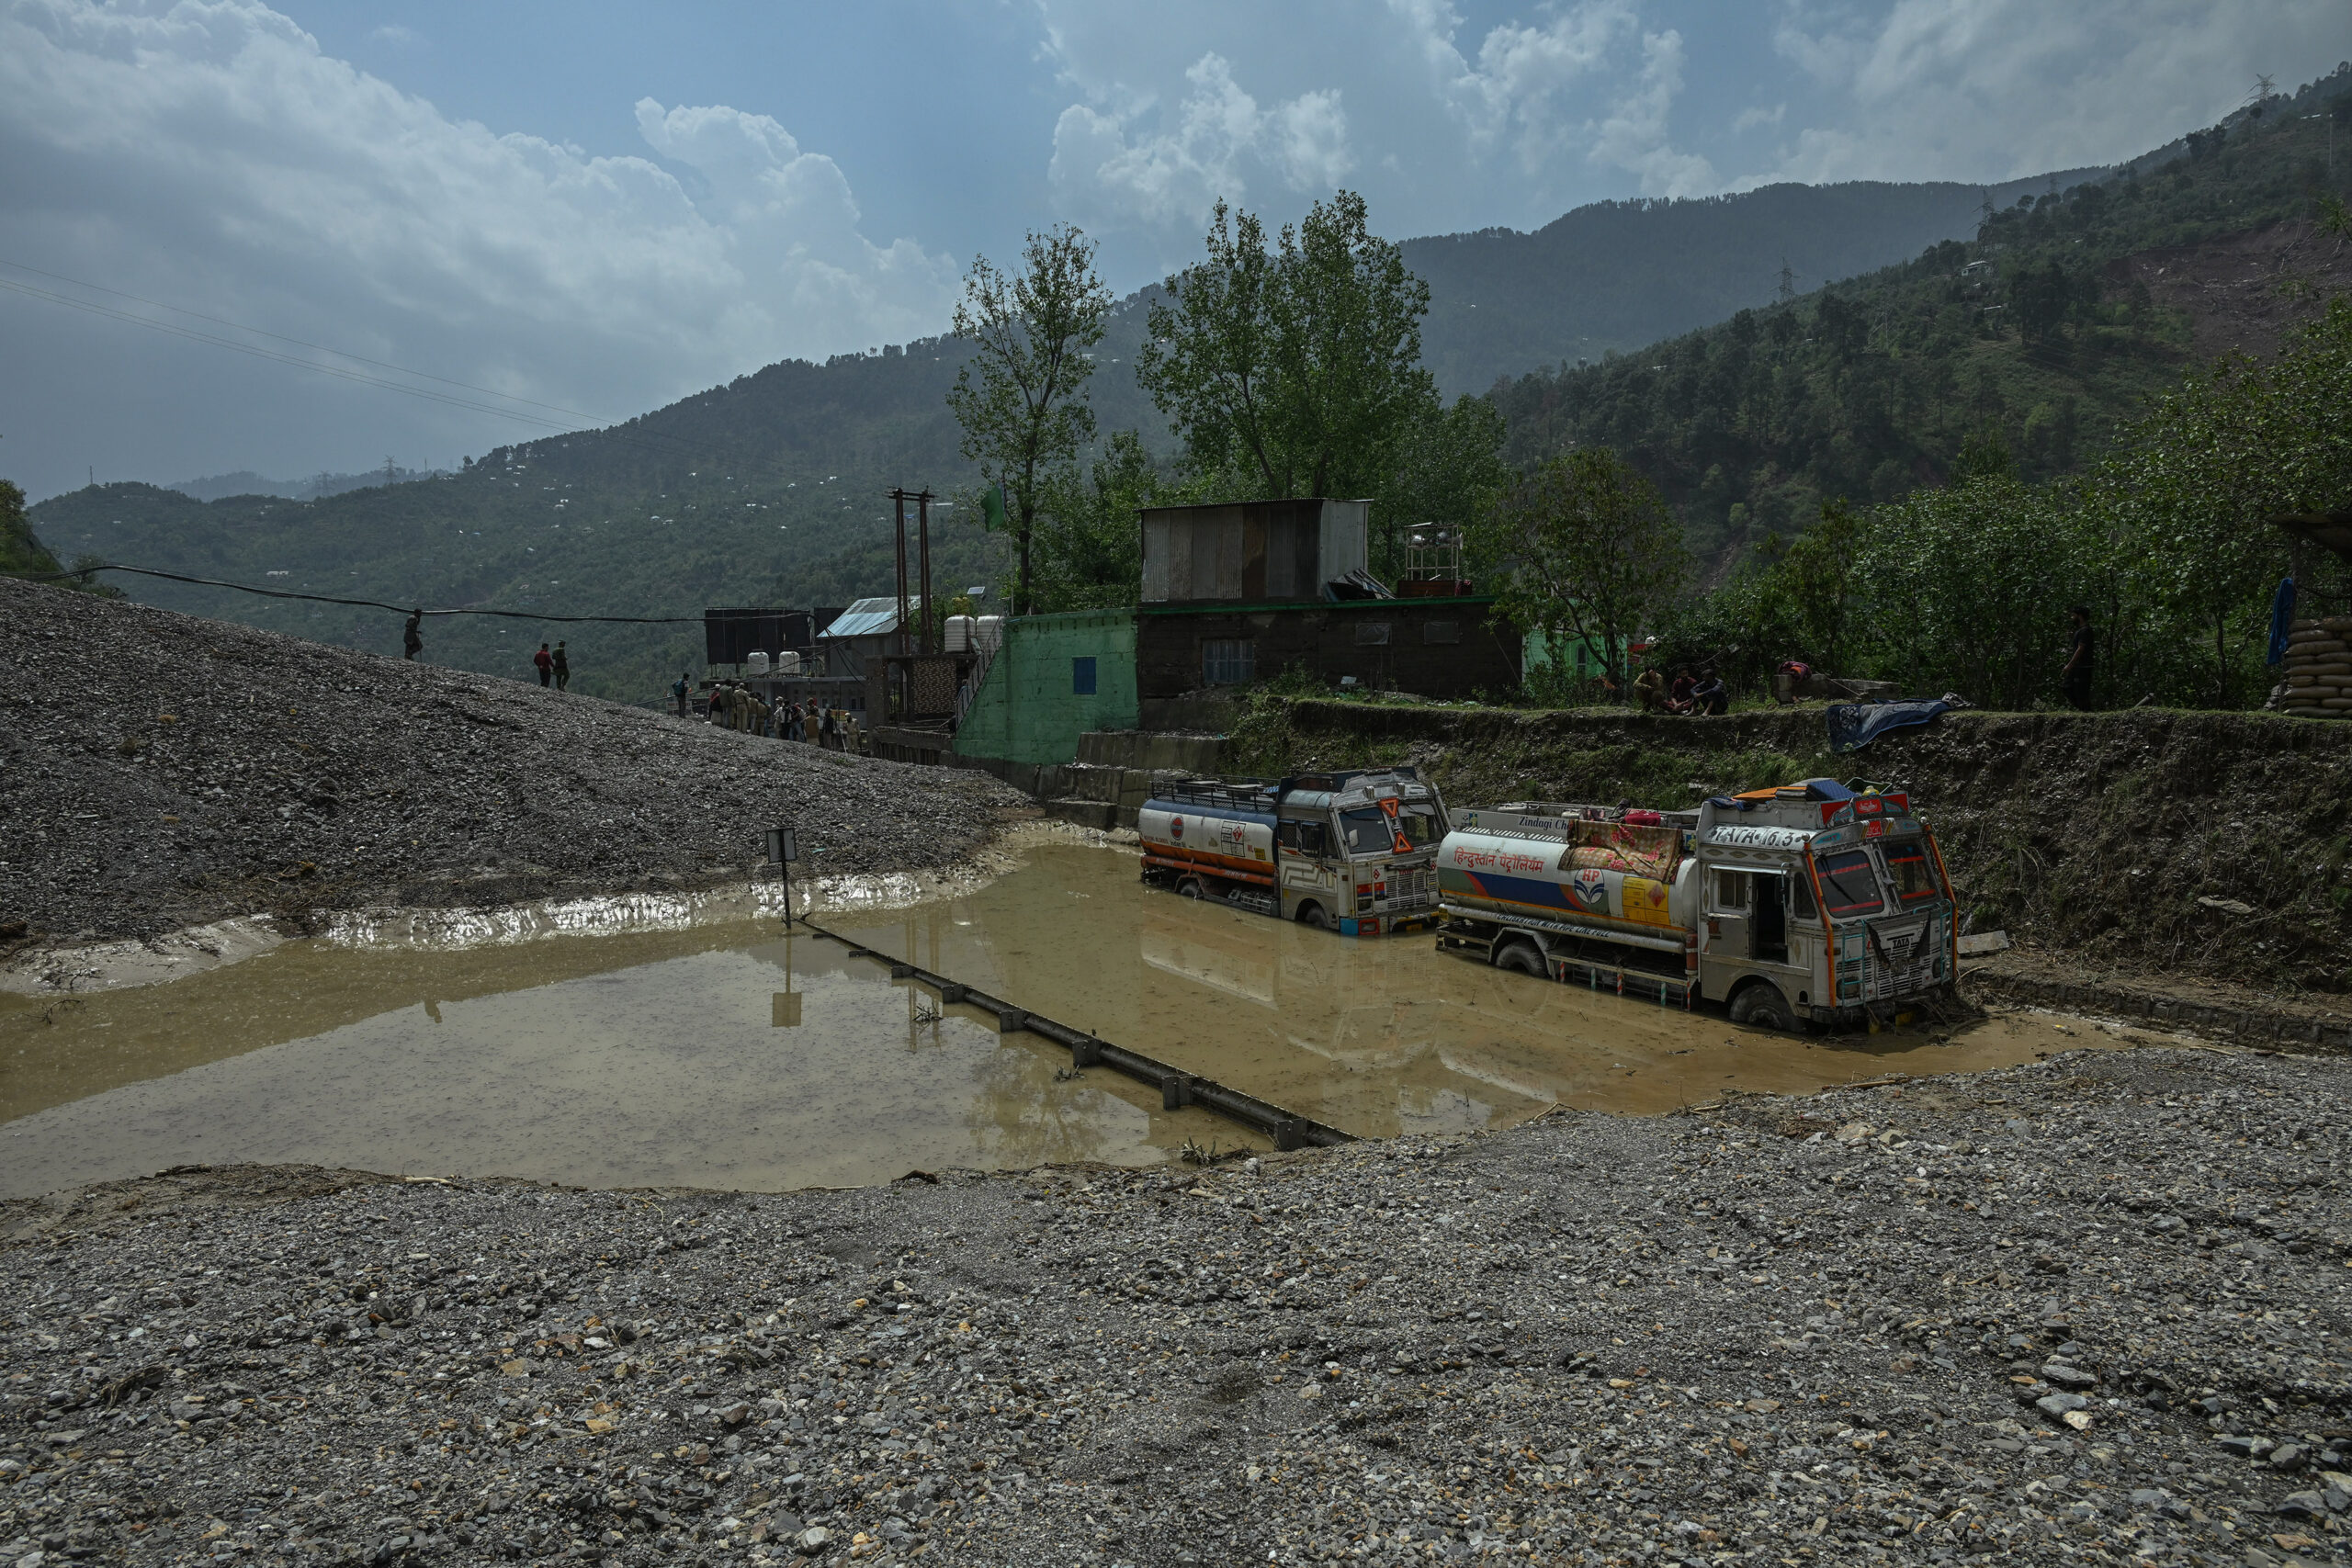
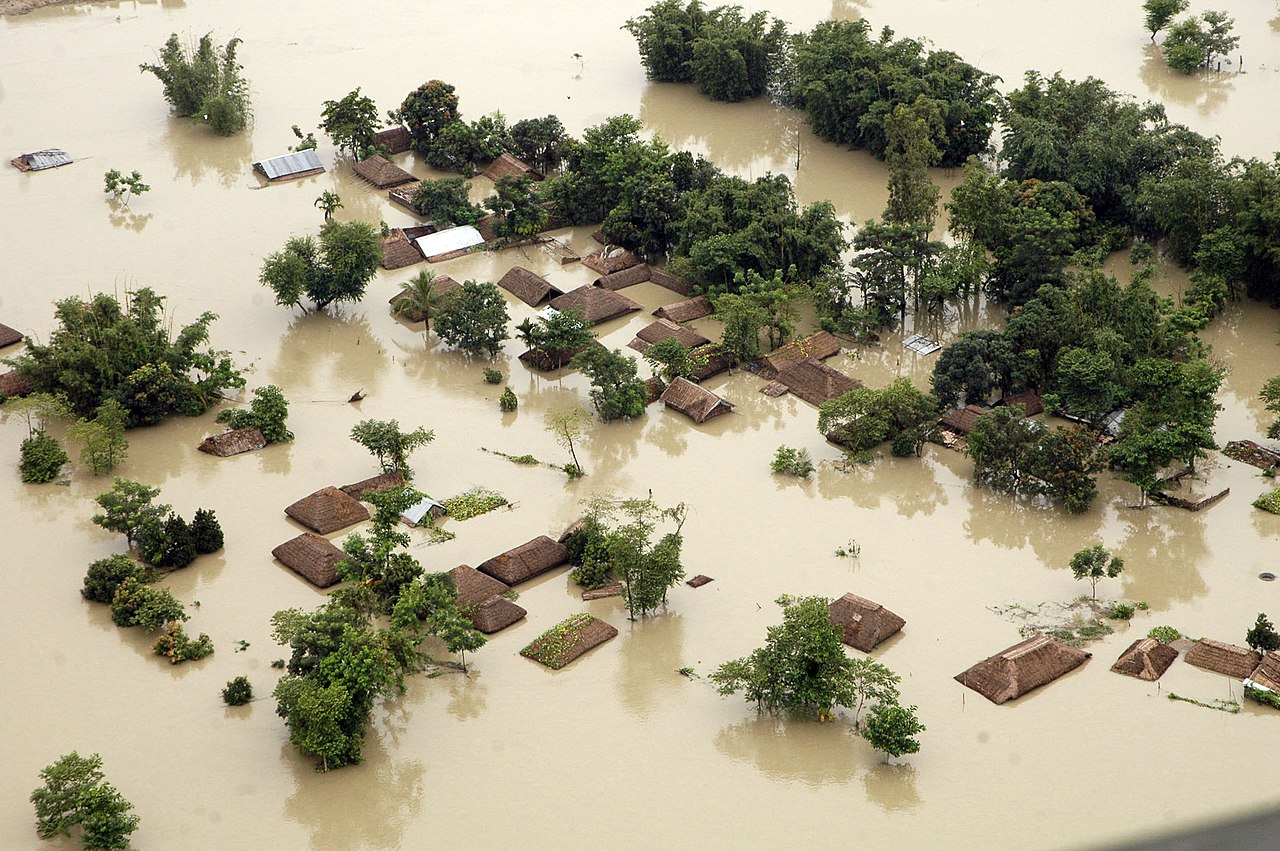
- However, the researchers in India share that the one km spatial resolution is not sufficient for a thorough analysis in India which has several small patches of forest land.
- For India, satellite-based mapping tools must be used along with additional field observations and biophysical data for a comprehensive understanding of deforestation drivers.
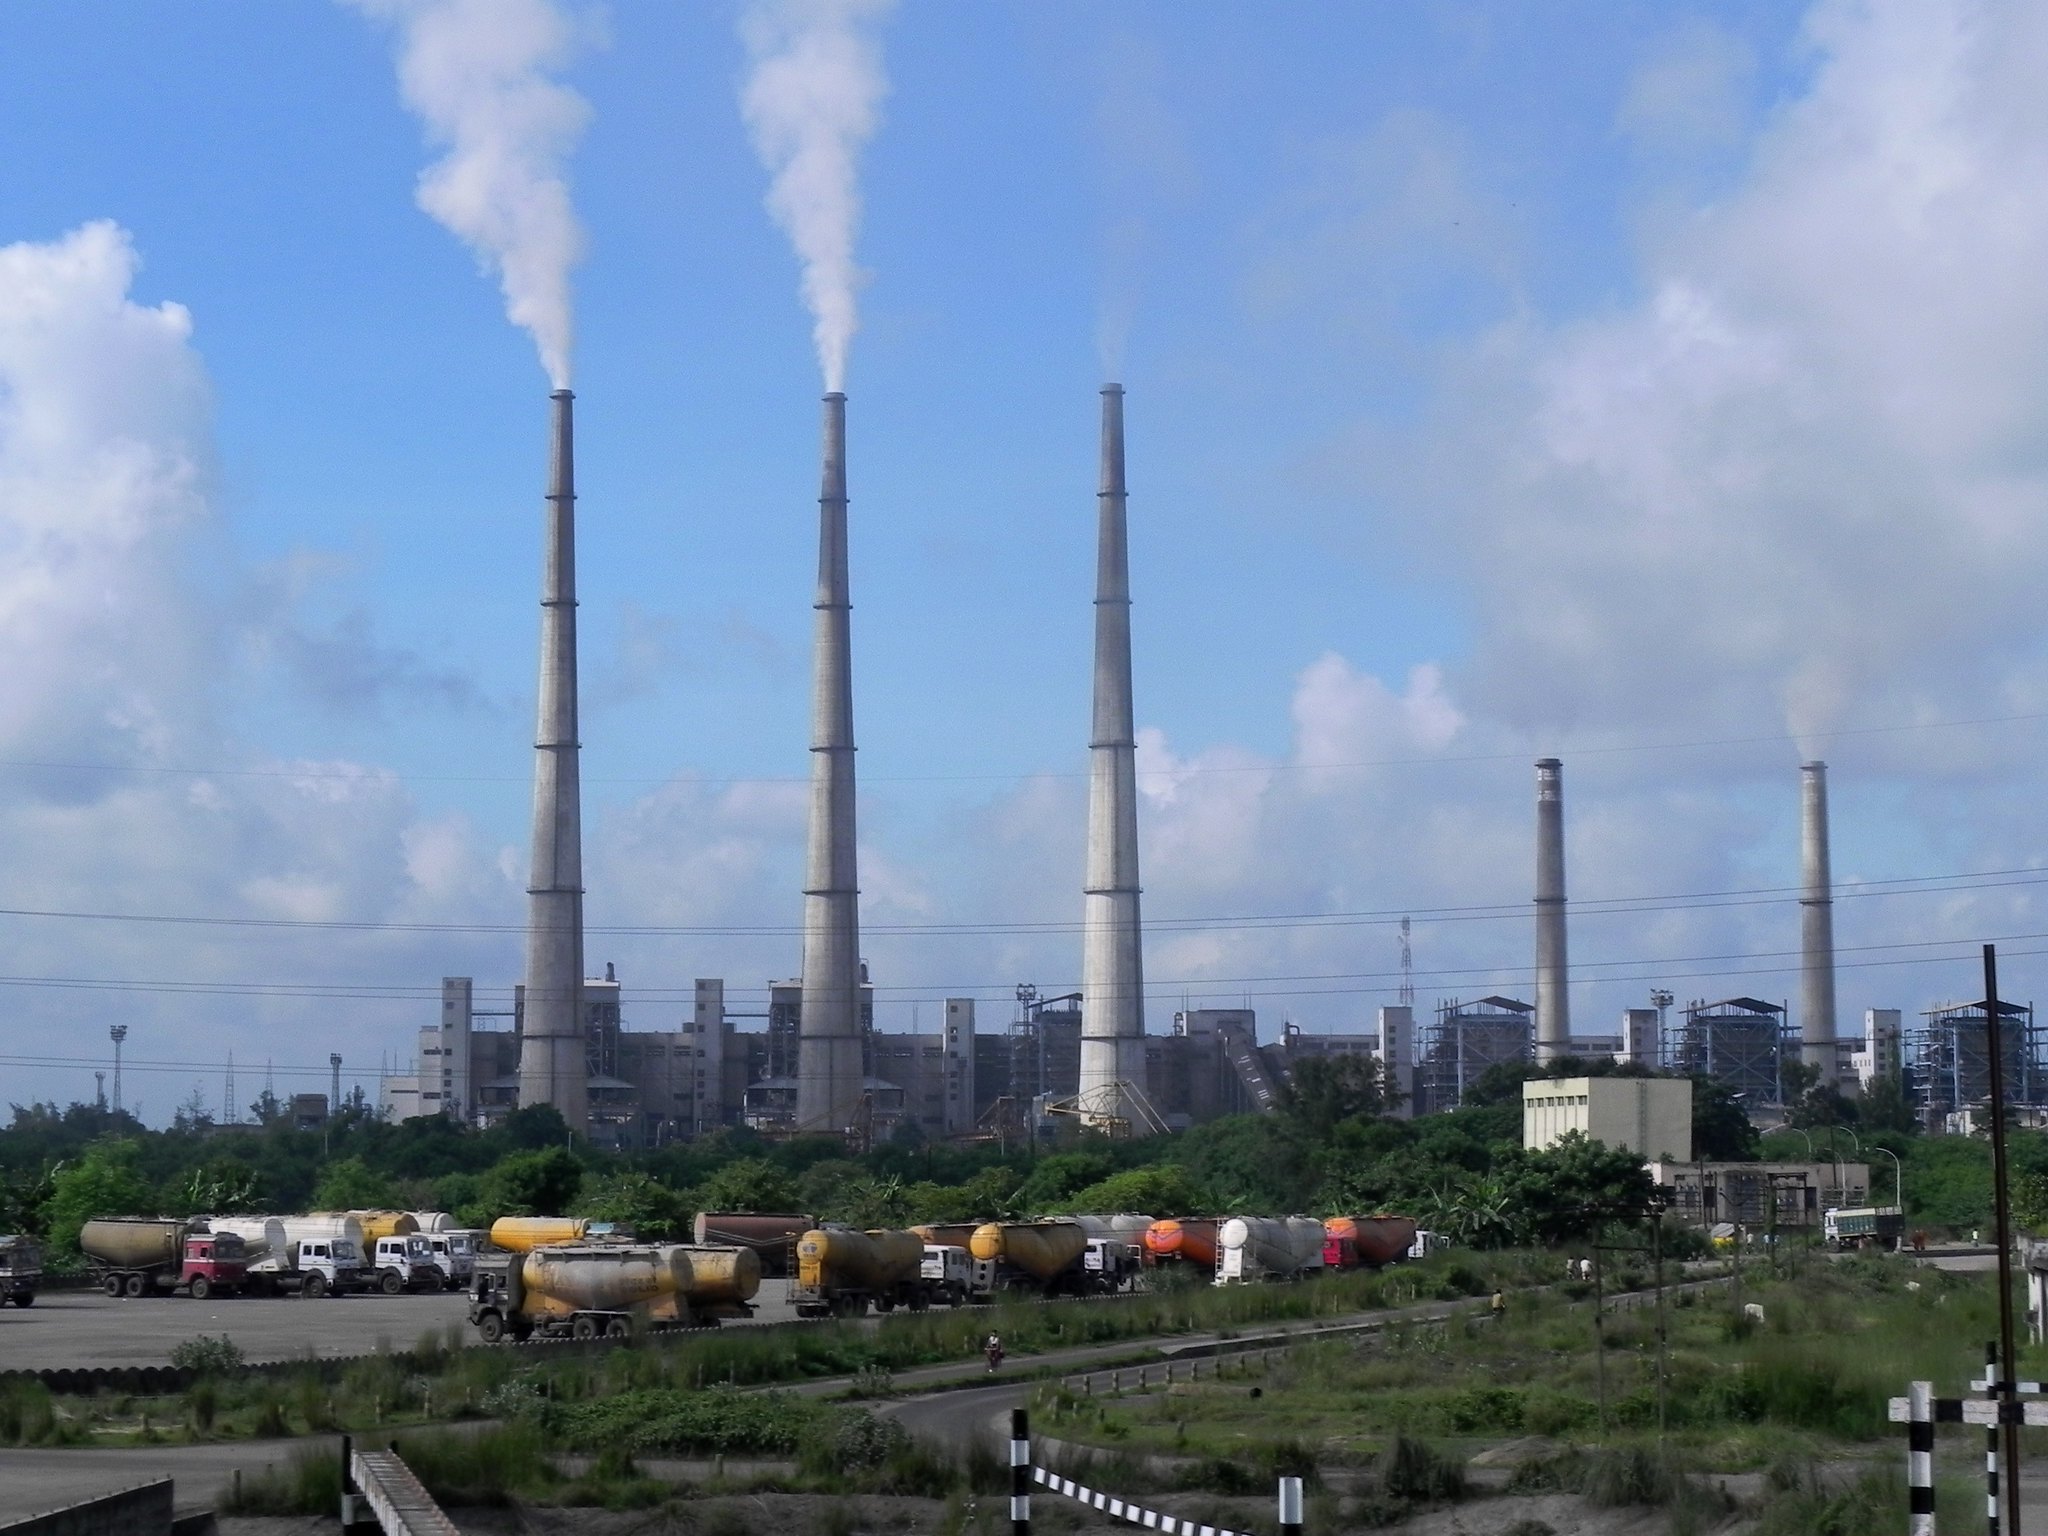
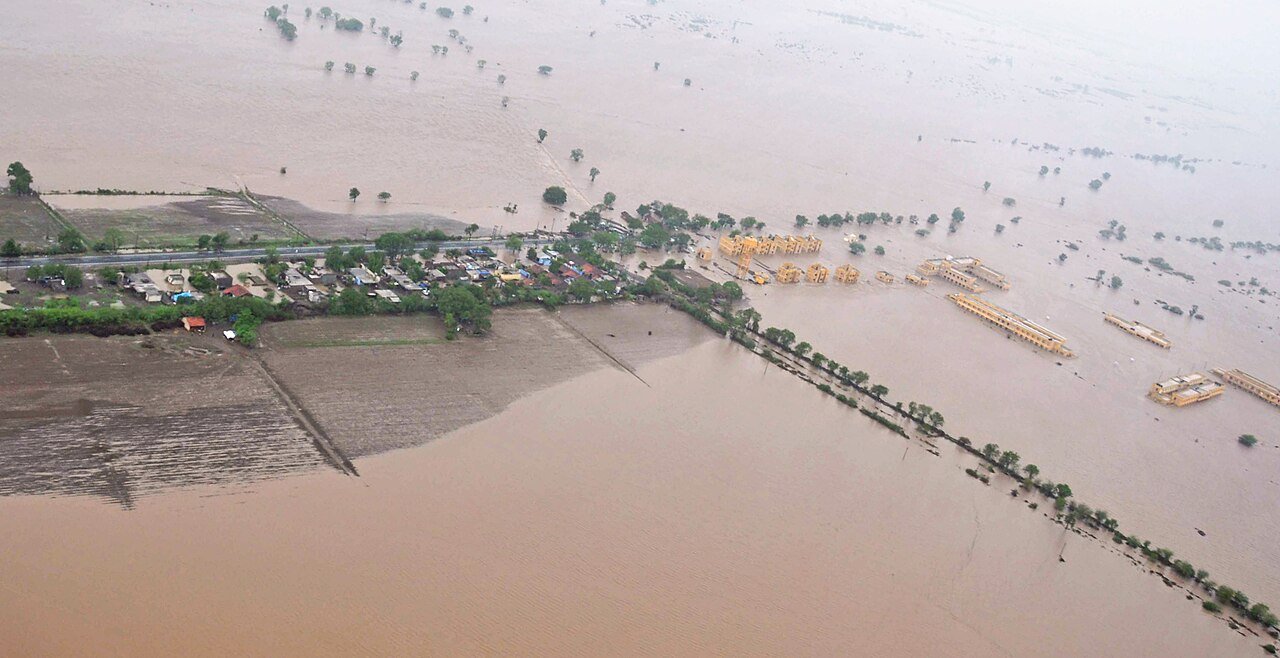
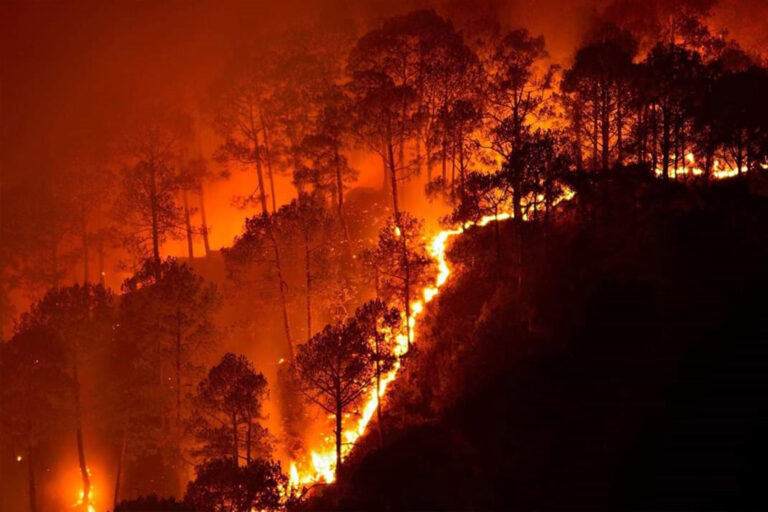
2024 was a record-breaking year for tropical forests globally. The world lost 18 football fields worth of tropical primary forests per minute in 2024, according to data gathered by the University of Maryland’s Global Land Analysis and Discovery (GLAD) Lab and shared on the World Resources Institute’s (WRI) Global Forest Watch platform. Along with greenhouse gas emissions of 3.1 gigatonnes, the deforestation also resulted in significant losses to biodiversity, ecosystem services and livelihoods, globally. The data revealed that forest fires were responsible for 49.5% of this loss.
Understanding the drivers of forest loss is vital to devise strategies for forest conservation and restoration. Such data can also shed light on whether these factors contribute to forest loss or degradation, thus differentiating between permanent changes to forest land (forest loss) and a reduction in tree canopy or density (forest degradation).
A new global dataset developed by the World Resources Institute, Google Deep Mind and The Sustainability Consortium determines the reasons for forest loss at one-kilometre spatial resolution. Using high-resolution satellite imagery and an artificial intelligence (AI) algorithm called ResNet, the researchers show the dominant drivers of tree cover loss between 2001 and 2022, distinguishing between seven drivers, including permanent agriculture, shifting cultivation, hard commodities, wildfires, logging, settlements and infrastructure, and other natural disturbances. The dataset reveals that permanent agriculture resulted in 34.8 ± 2.6% of global tree cover loss between 2001 and 2022.
Improved distinction between deforestation drivers
The dataset was built by training the AI model to identify drivers of forest loss. The training samples (high-resolution 1 km grid cells with at least 0.5% tree cover loss) were visually interpreted by experts. These labelled samples provided the basis for the model to analyse and interpret satellite imagery along with relevant population and biophysical data inputs, thus associating the pattern with a driver class.
In 2018, WRI, along with researchers at the University of Maryland and the University of Arkansas, published a classification model for global forest loss drivers between 2001 and 2015. The data examined forest loss at a spatial resolution of 10 km. In comparison, the current dataset provides a higher resolution and greater distinction between drivers that have similar spatial patterns.
Lead author Michelle J. Sims, a geospatial researcher at WRI, USA, explains that capturing the various disturbances included within each driver class across regions was one of the challenges that the team encountered. “For example, the ‘other natural disturbances’ class includes disturbances such as insect outbreaks, landslides, windthrow, meandering rivers, and damage from storms. Similarly, ‘logging’ can include various types of wood harvest (clear-cut or selective logging, or harvesting cycles in tree plantations), and often has different patterns in various parts of the world,” shares Sims. To address this challenge, the team collected additional training data to improve the model and its recognition of drivers.
Apart from global drivers, the dataset also shows regional drivers for tree cover loss. For Asia, the analysis reveals that wildfires were the dominant drivers at 65.4% followed by logging at 26.3% and permanent agriculture at 2.5%.
‘India needs a more thorough analysis’
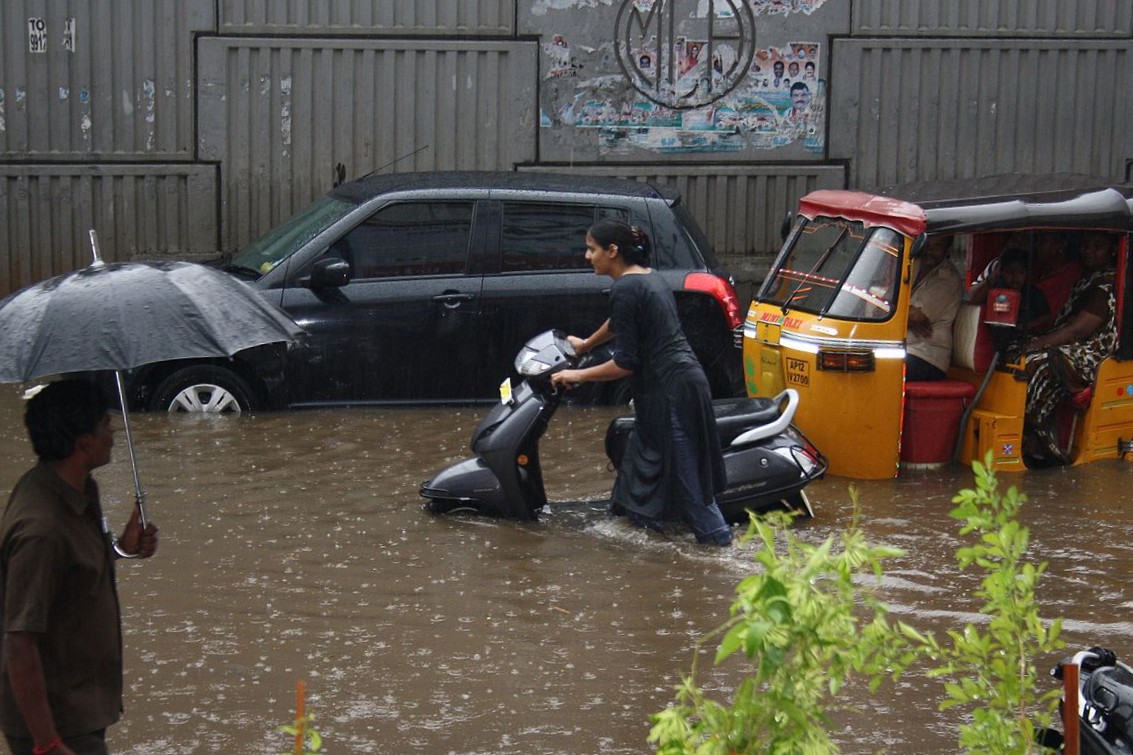
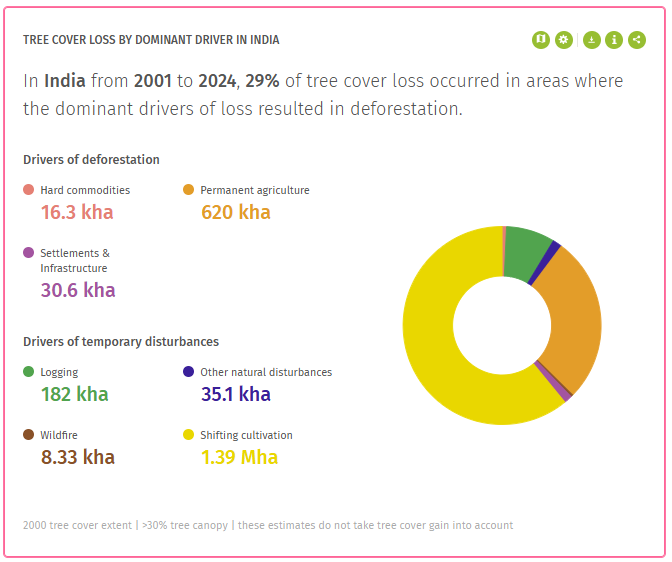
The GFW interactive map reveals that between 2001 and 2024, 29% of tree cover loss in India resulted in deforestation, with permanent agriculture, hard commodities, and settlements and infrastructure being the dominant drivers.
The map also reveals that the resulting emissions were about 15 million metric tonnes of carbon dioxide equivalent per year. When zoomed in, similar results can also be obtained for forests at the state and district-level. However, researchers in India warn that this data must be used with caution.
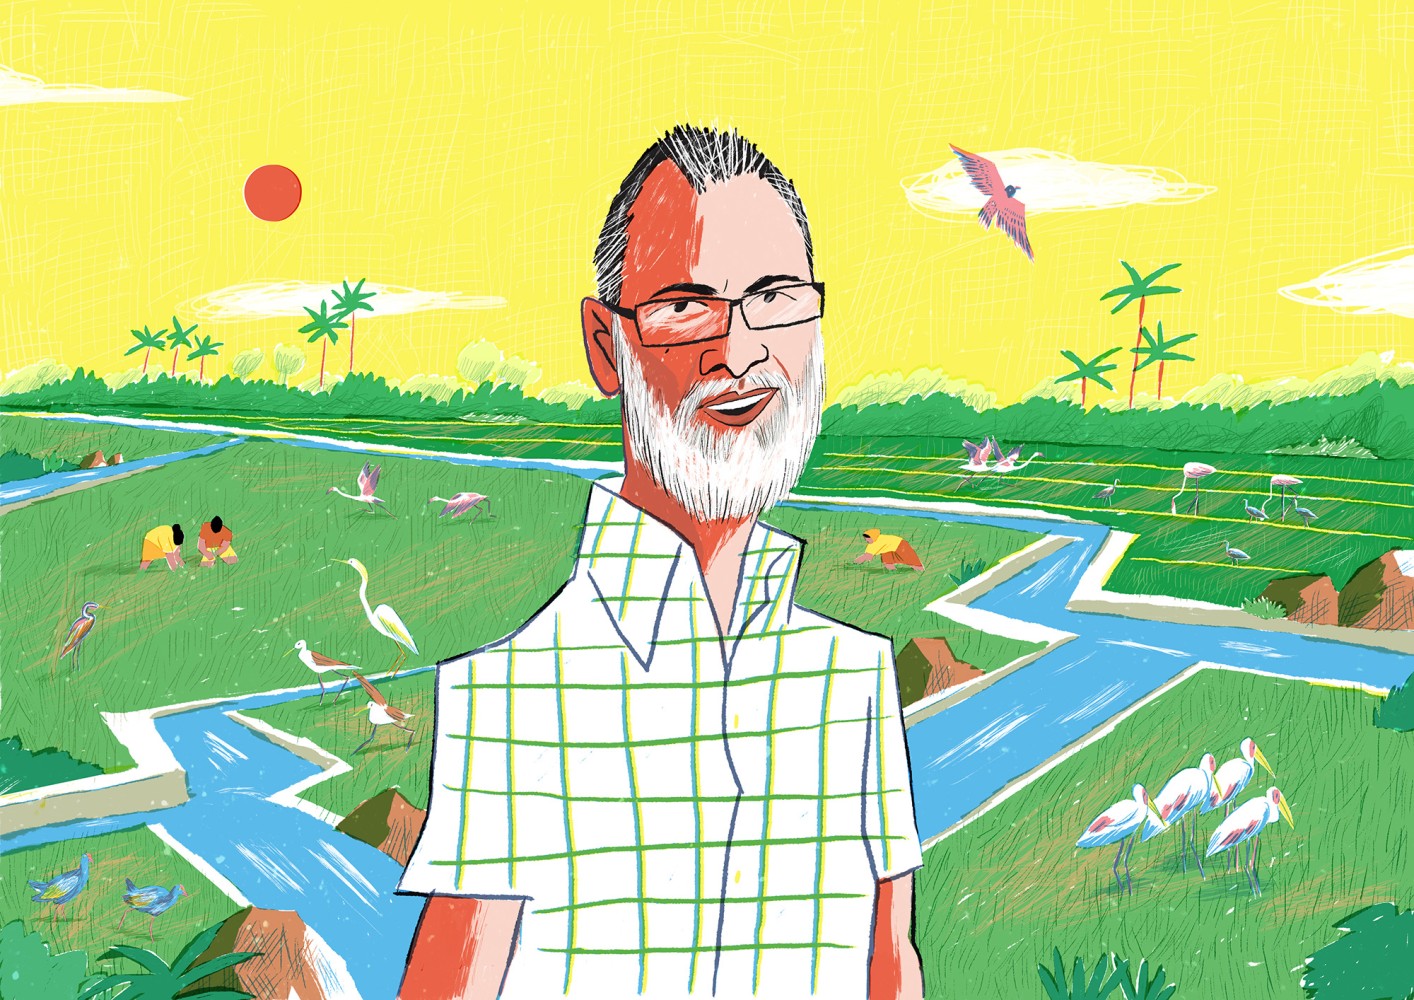
“The dataset is an extremely useful tool, especially for someone who wants to gain a quick impression of deforestation rates in a particular country or understand where they would like to focus their afforestation efforts,” says Seshadri KS, faculty member at the Ashoka Trust For Research In Ecology And The Environment, Bengaluru. “Having worked with many similar tools, I can say that the researchers have done a very good job. However, for India, the 1 km spatial resolution is not sufficient for a thorough analysis,” he adds.
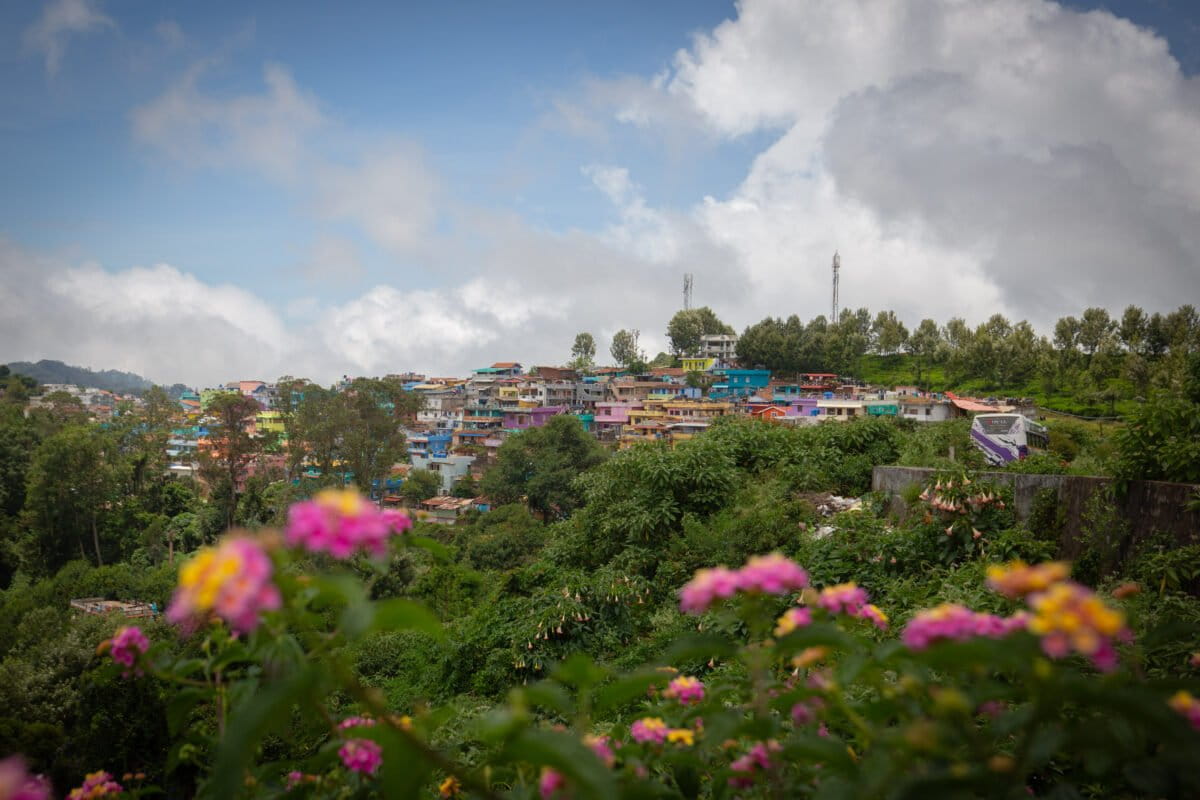
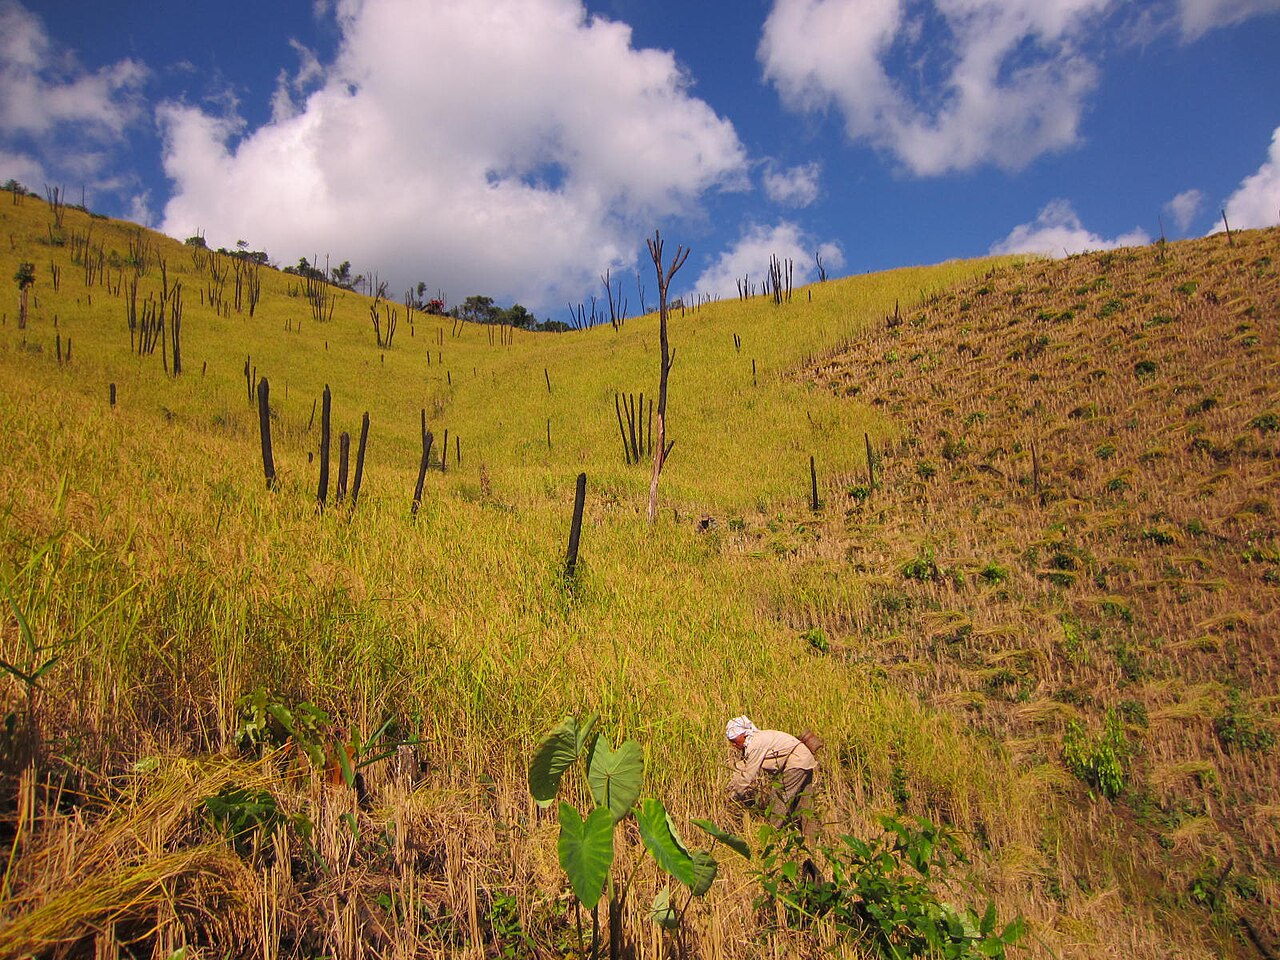
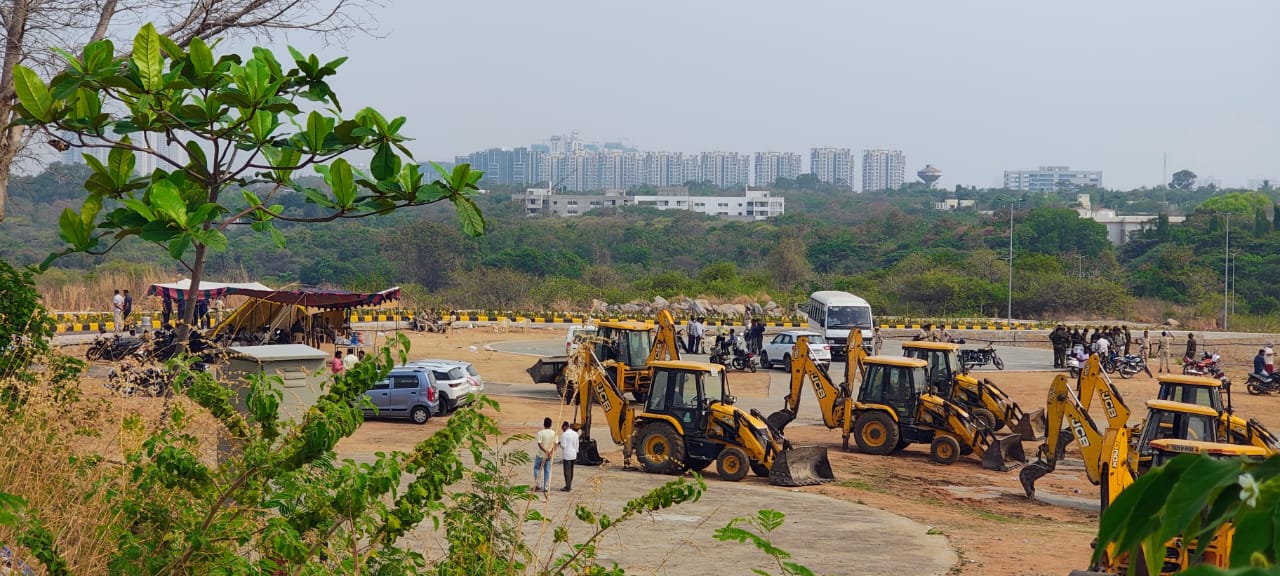
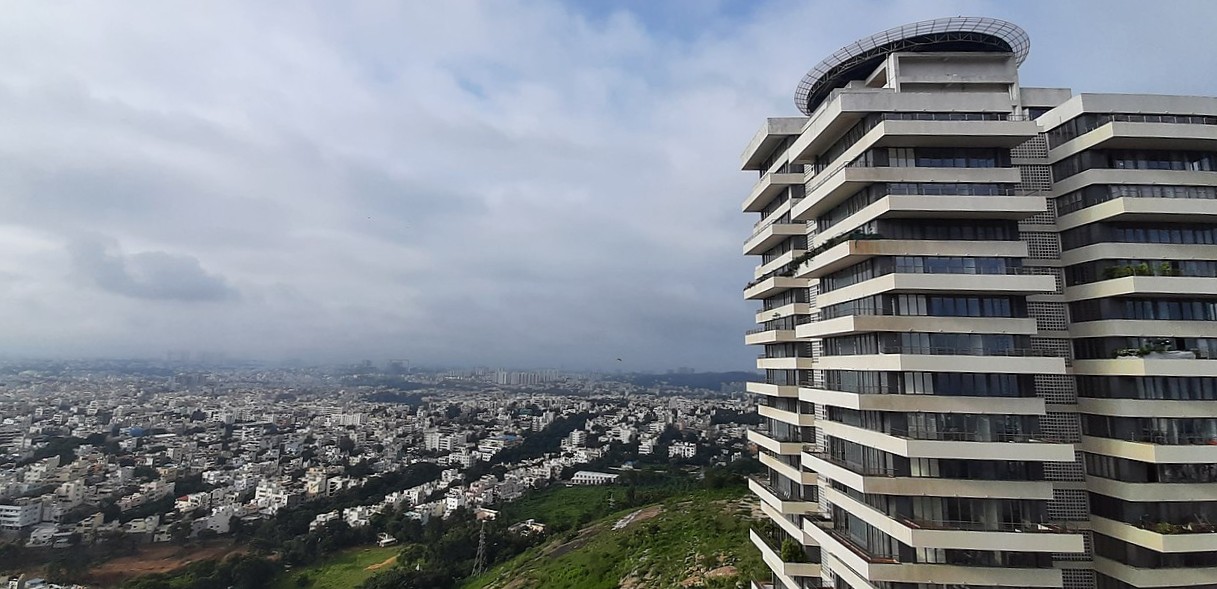
Both Seshadri and Dhanapal Govindarajulu, a researcher at the Global Development Institute, University of Manchester, explain that India has several smaller patches of forest land and mosaic landscapes where forests and plantations co-exist, creating a fragmented ecosystem. “The tool will benefit the examination of vast tracts of forests and deforestation at a scale of more than 1 km. In India, we see the clearance of one or two hectares of forest land or the removal of trees for road widening projects. These small-scale deforestation events are usually not captured by such maps,” says Dhanapal.
The definition of what constitutes a forest plays a crucial role in analysing the results of satellite imagery-based mapping tools, explains Dhanapal. India defines forest cover as — all land, more than one hectare in area, with a tree canopy cover of more than 10%, irrespective of ownership and legal status.
“A lot of the criticism that The India State of Forest Reports (ISFR) have received is that this (definition) captures areas such as plantations, orchards and other places where tree density is high. The distinction is not evident. While plantations outside forests for timber purposes are classified as forest, their harvest is not considered deforestation,” says Dhanapal.
Sims agrees that this can be a challenge and adds that maps derived from satellite imagery often look at ‘land cover’ or the observed physical cover on the earth, such as the presence of trees. “For example, in our dataset, tree cover is defined as woody vegetation exceeding five metres in height. A user hoping to understand the drivers of disturbances within an area where ‘forest’ is defined using a more limited set of criteria than this broad definition can use additional data (such as a baseline map, canopy density threshold, or a designated area of interest) to focus their analysis only on those specific areas,” says Sims.
“Ultimately, maps derived from satellite data have provided enormous benefits by enabling cost-effective mapping and monitoring across large areas. Advances in remote sensing are greatly improving our ability to deal with the challenges of mapping more complex landscapes. Challenges do remain, and additional types of data may be essential in some cases,” she adds.
A multi-pronged analysis of deforestation drivers
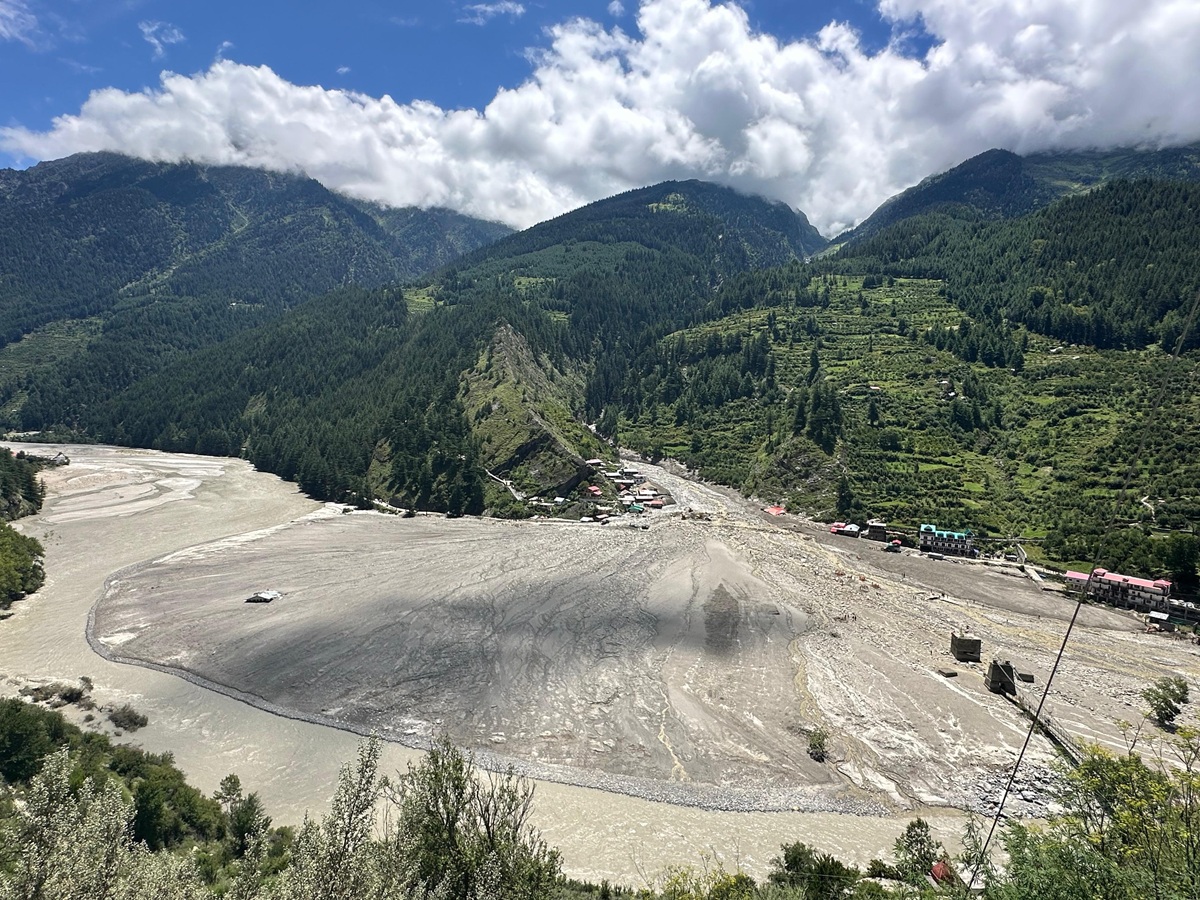
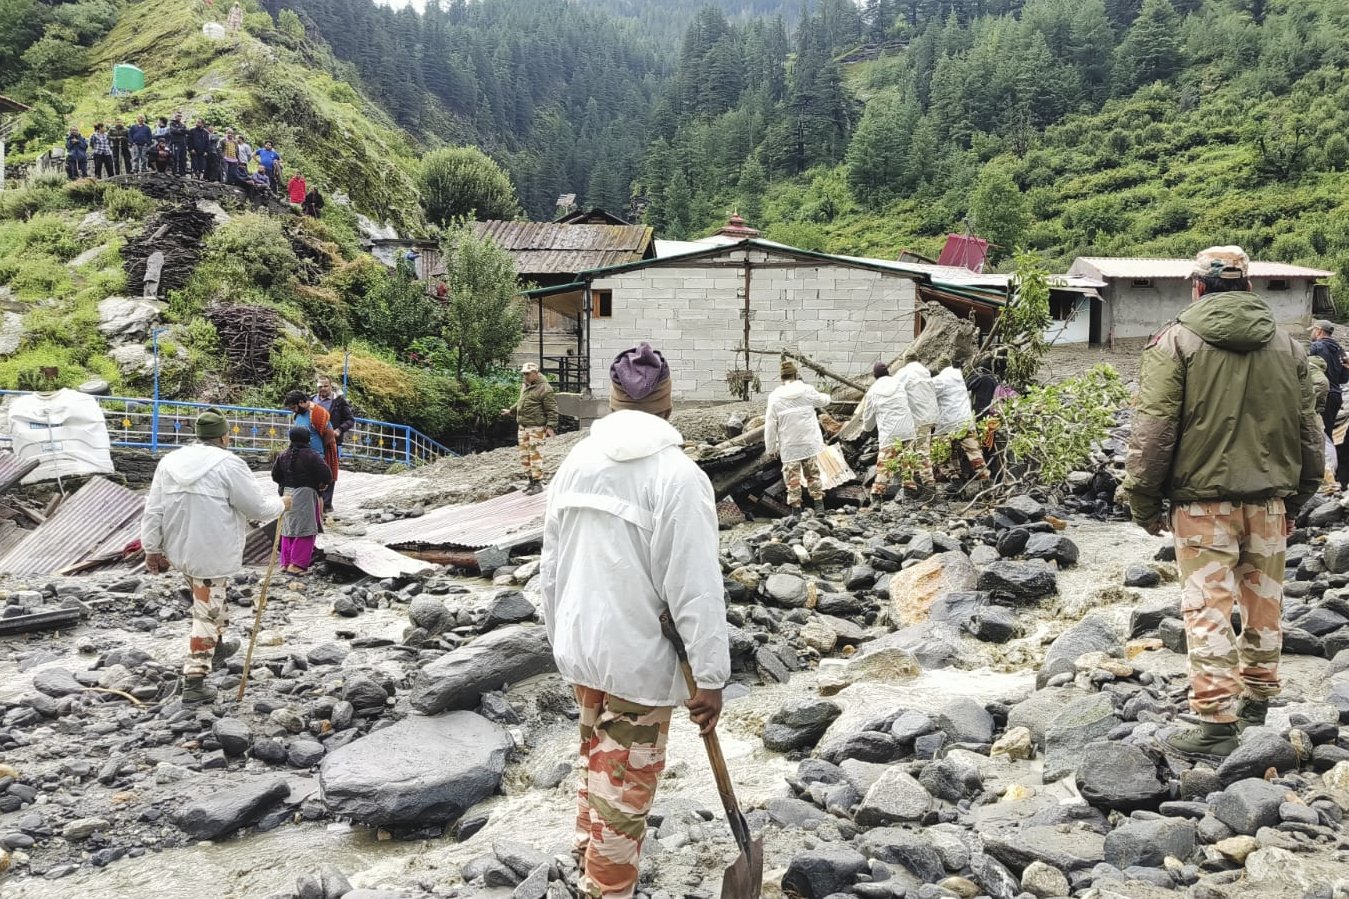
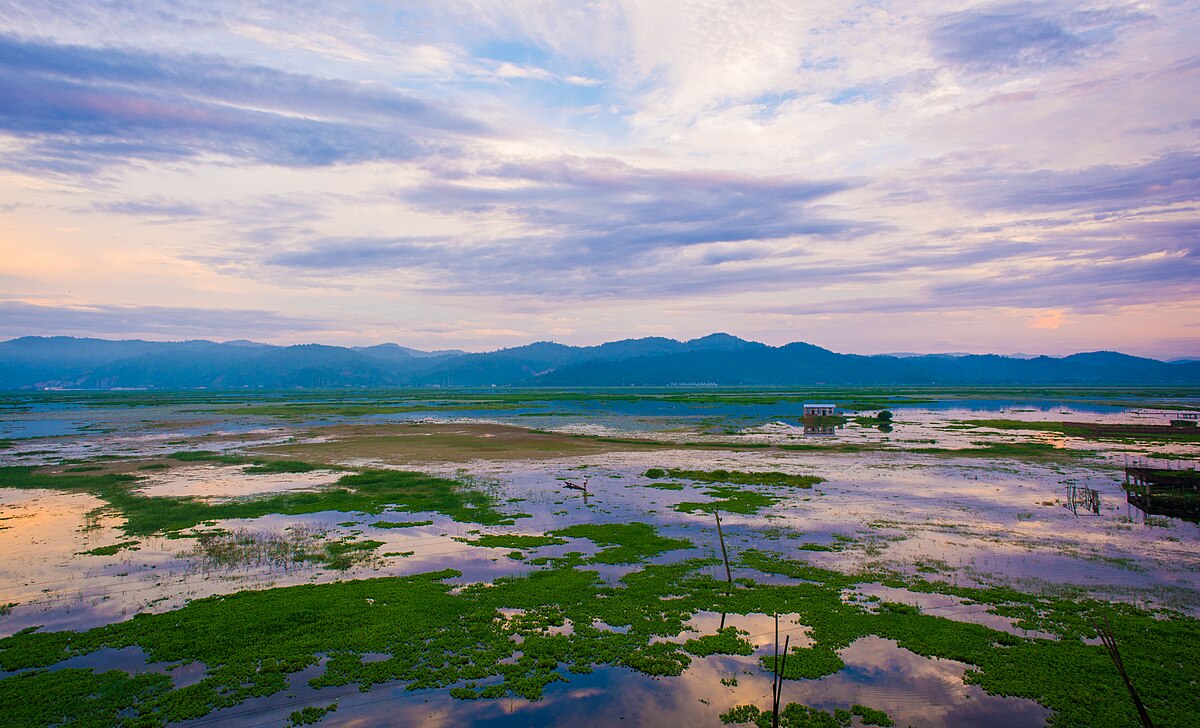
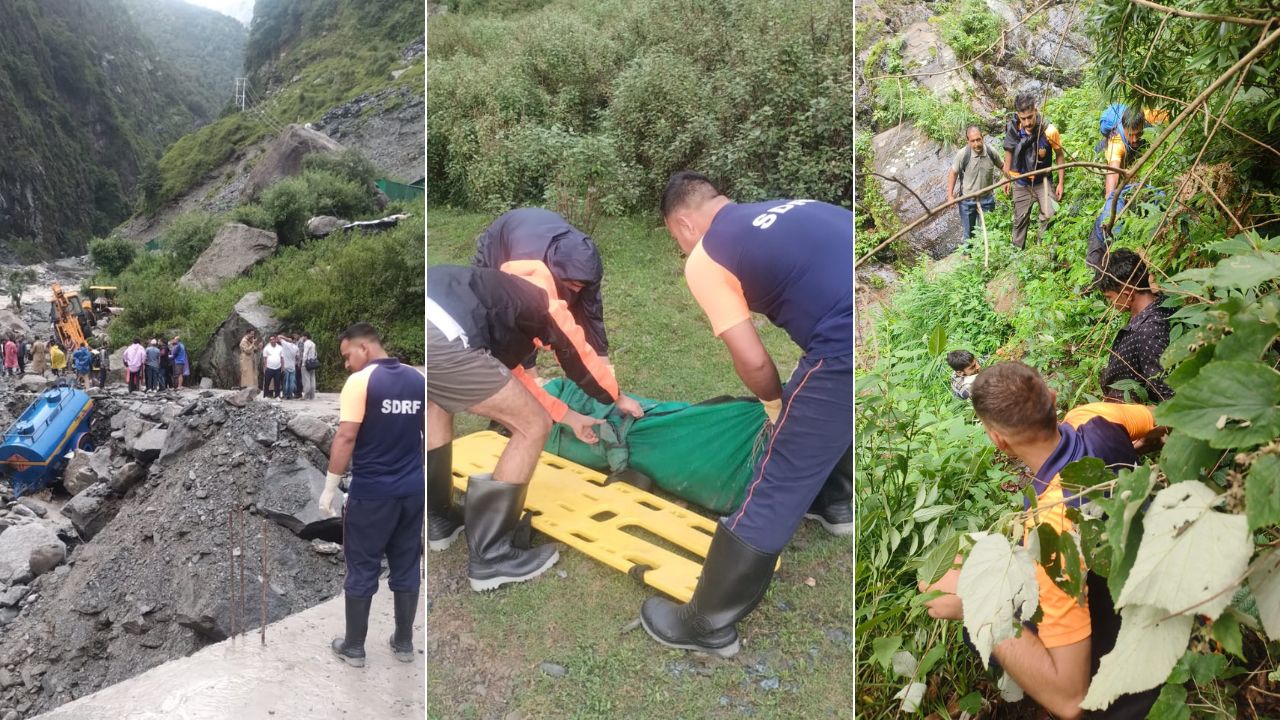
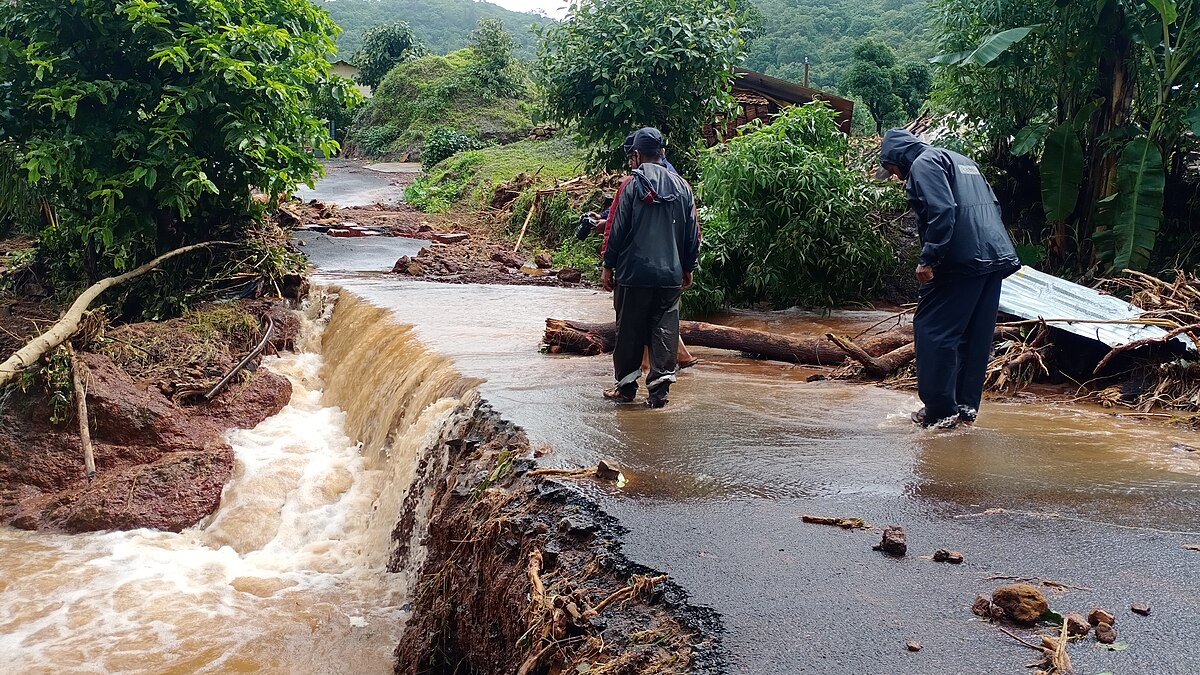
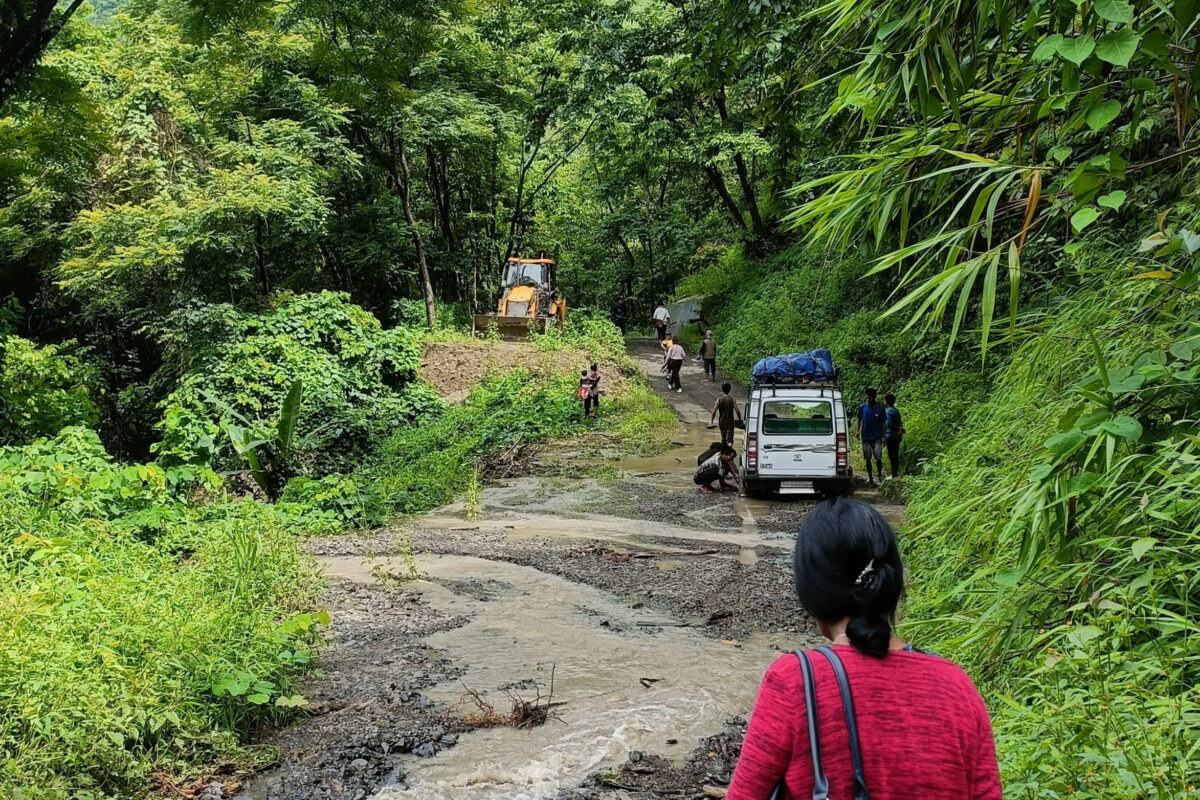
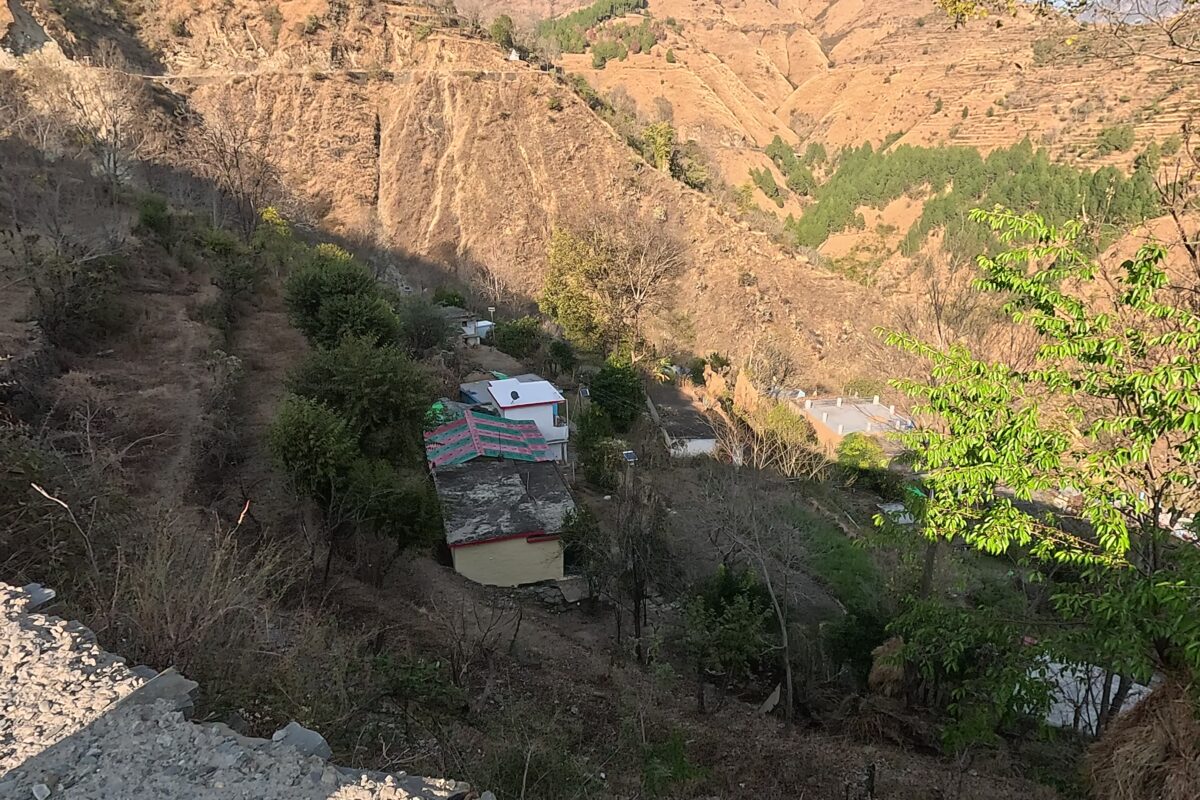
A 2024 study by the Institute of Wood Science and Technology (ICFRE-IWST), National Institute of Advanced Studies (NIAS) and Indian Institute of Science (IISC), analysed the ecological impacts of landslide-driven deforestation in and around the Kali Tiger Reserve (KTR), Karnataka. The study shows that gaining a true understanding of the drivers and impacts of deforestation requires a multi-source, multi-temporal data approach.
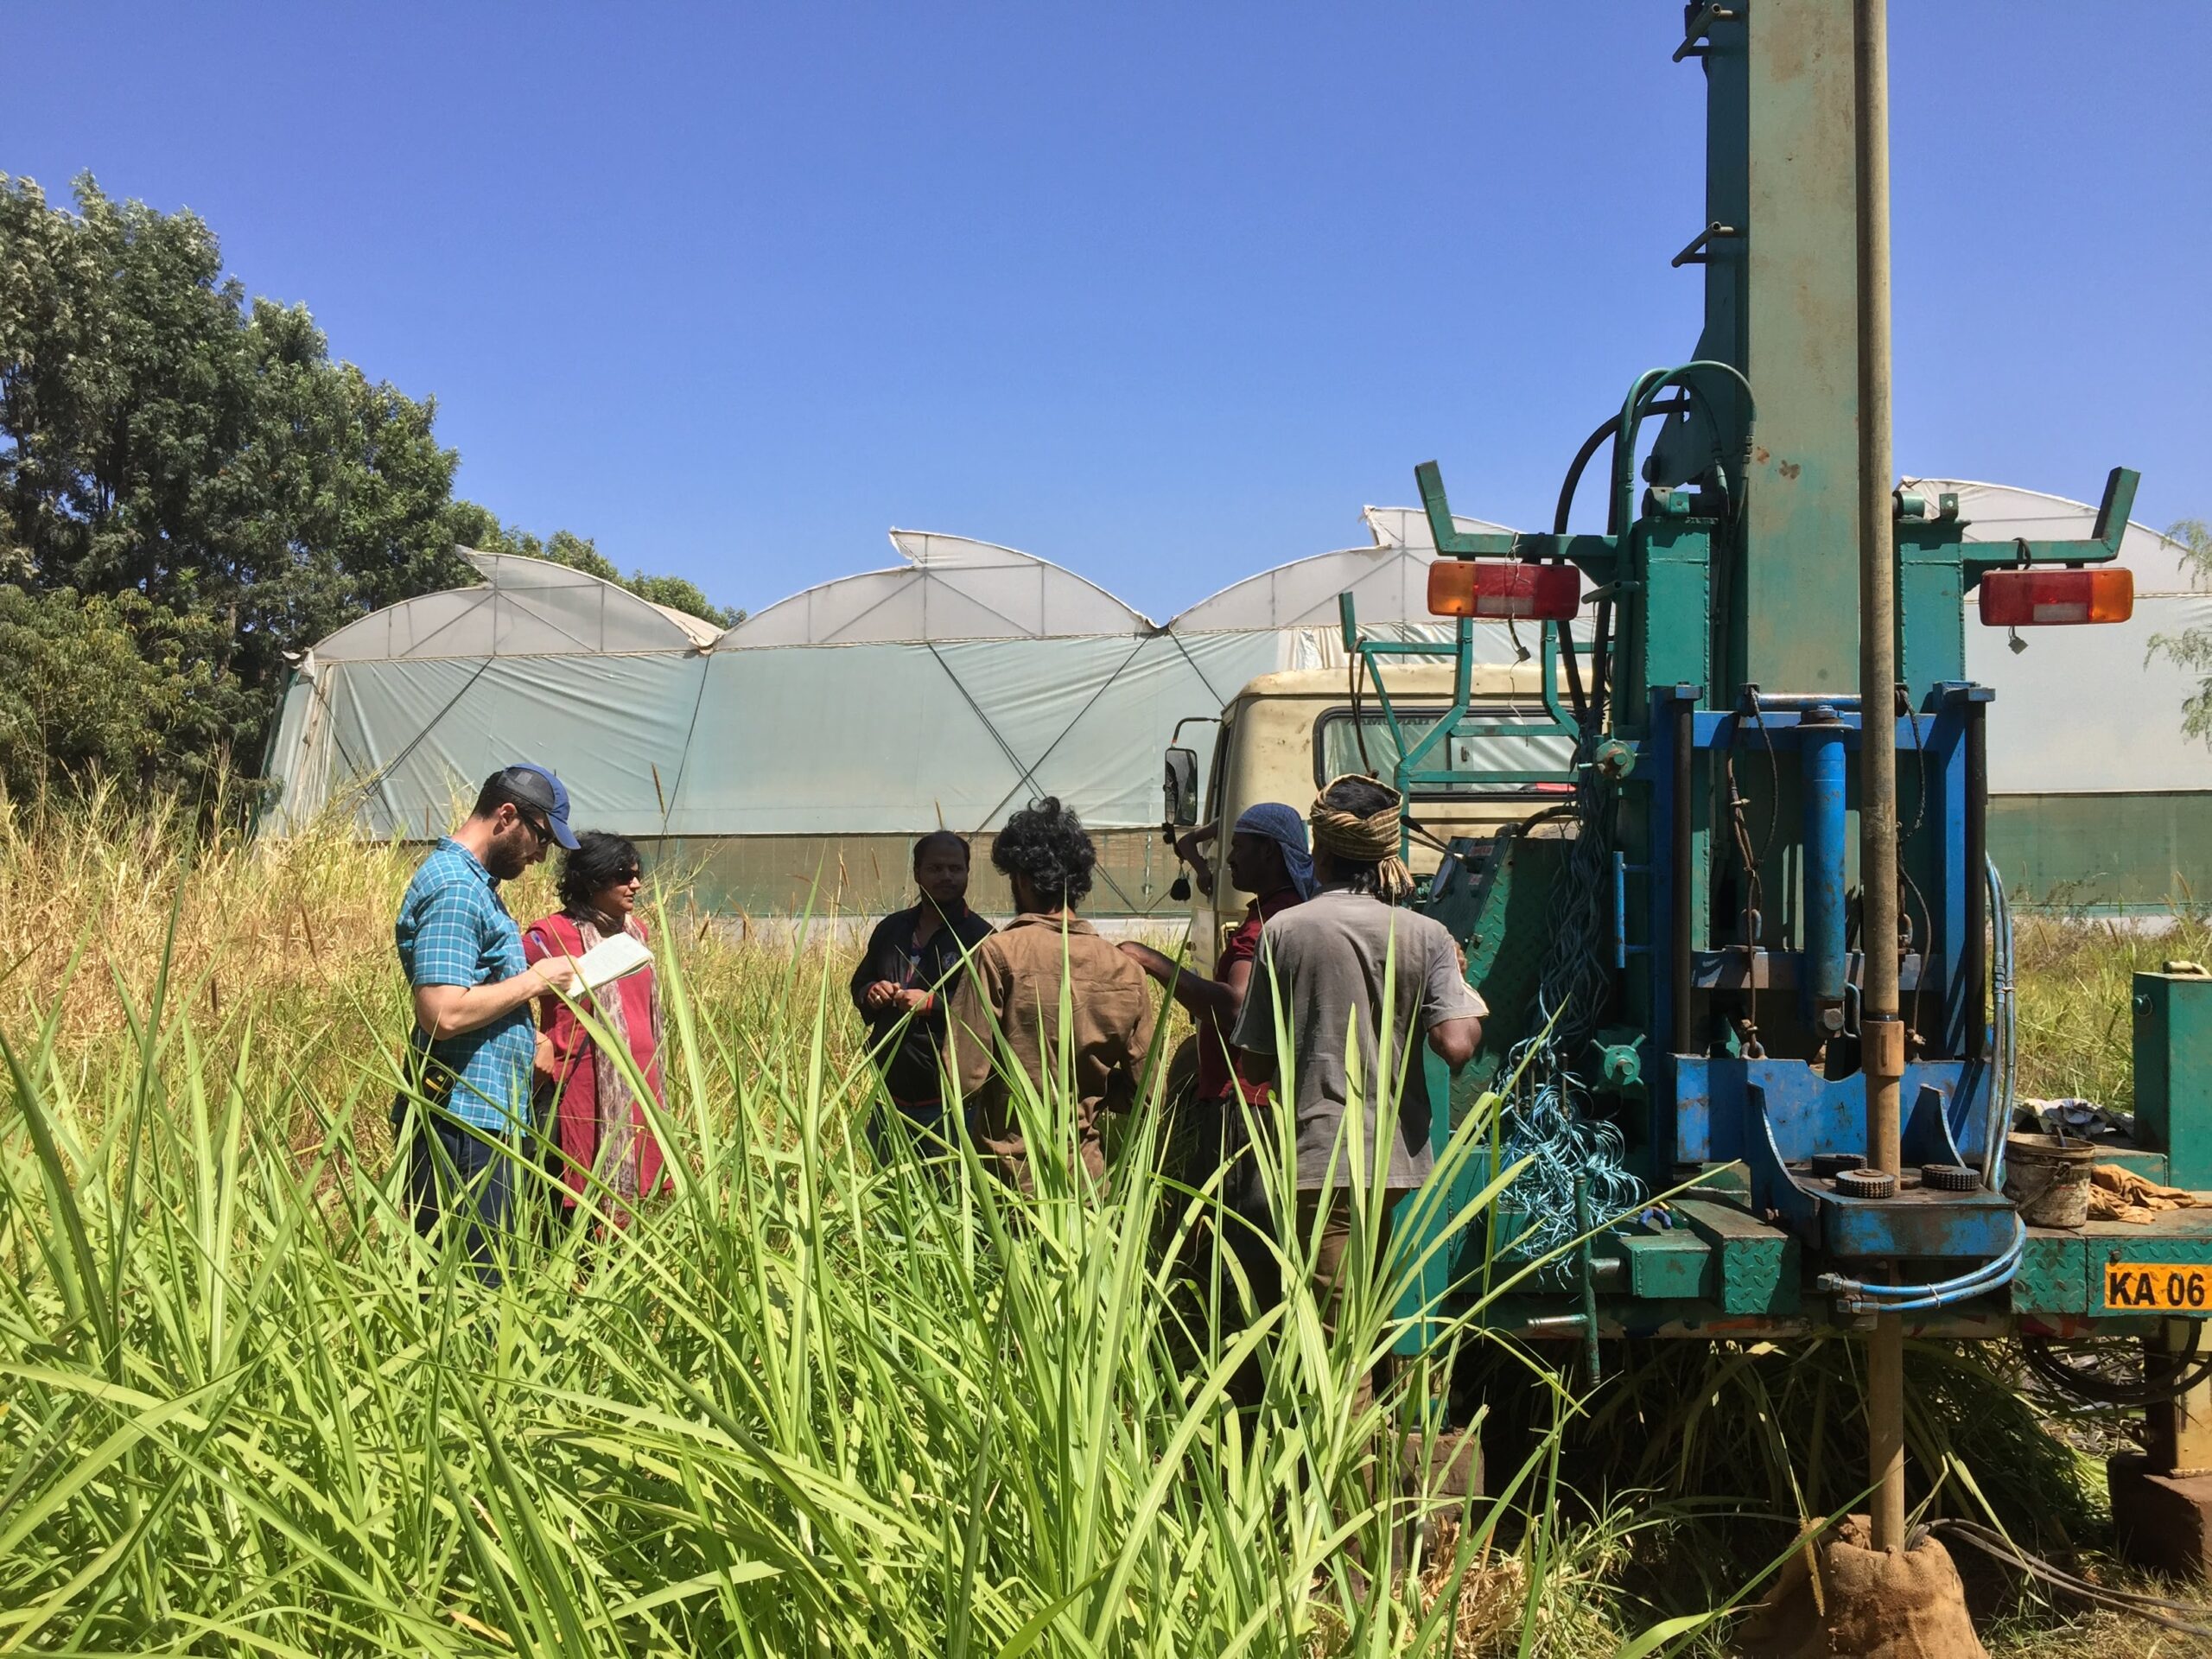
“We integrated multiple data sources, including landslide records from the Disaster Management Authority, district-level statistics on rainfall and temperature, as well as satellite-derived land surface temperature and moisture indices. This framework allowed us to identify forest loss both within and outside protected areas, providing spatially explicit and location-specific data that are vital for targeted conservation interventions. This approach enabled a comprehensive understanding of the complex causes and cascading effects of deforestation in sensitive landscapes,” T.N. Manohara, Scientist at the ICFRE-IWST, tells Mongabay India.
Manohara further shares that a key innovation of the research is the development of a high-resolution (10 m) deforestation monitoring map, specifically targeting landslide-prone zones. “This enhanced spatial resolution allows us to capture subtle ecological changes — such as forest fragmentation, tree height loss, and shifts in surface temperature and soil moisture — factors often overlooked by coarser global datasets,” he says.
Crucially, the study also examined pre- and post-landslide temperature changes, relating them to variations in vegetation and moisture to develop a more comprehensive ecological profile of the affected areas. The researchers also incorporated field-based observations, revealing an increase in invasive species colonisation, particularly Chromolaena odorata, in areas disturbed by landslides.
Along with a multi-pronged approach, Seshadri also emphasises the need for long-term monitoring of forests for effective intervention strategies. He explains that even small-scale forest degradation can have various impacts in the longer term that can change the nature of the ecosystem.
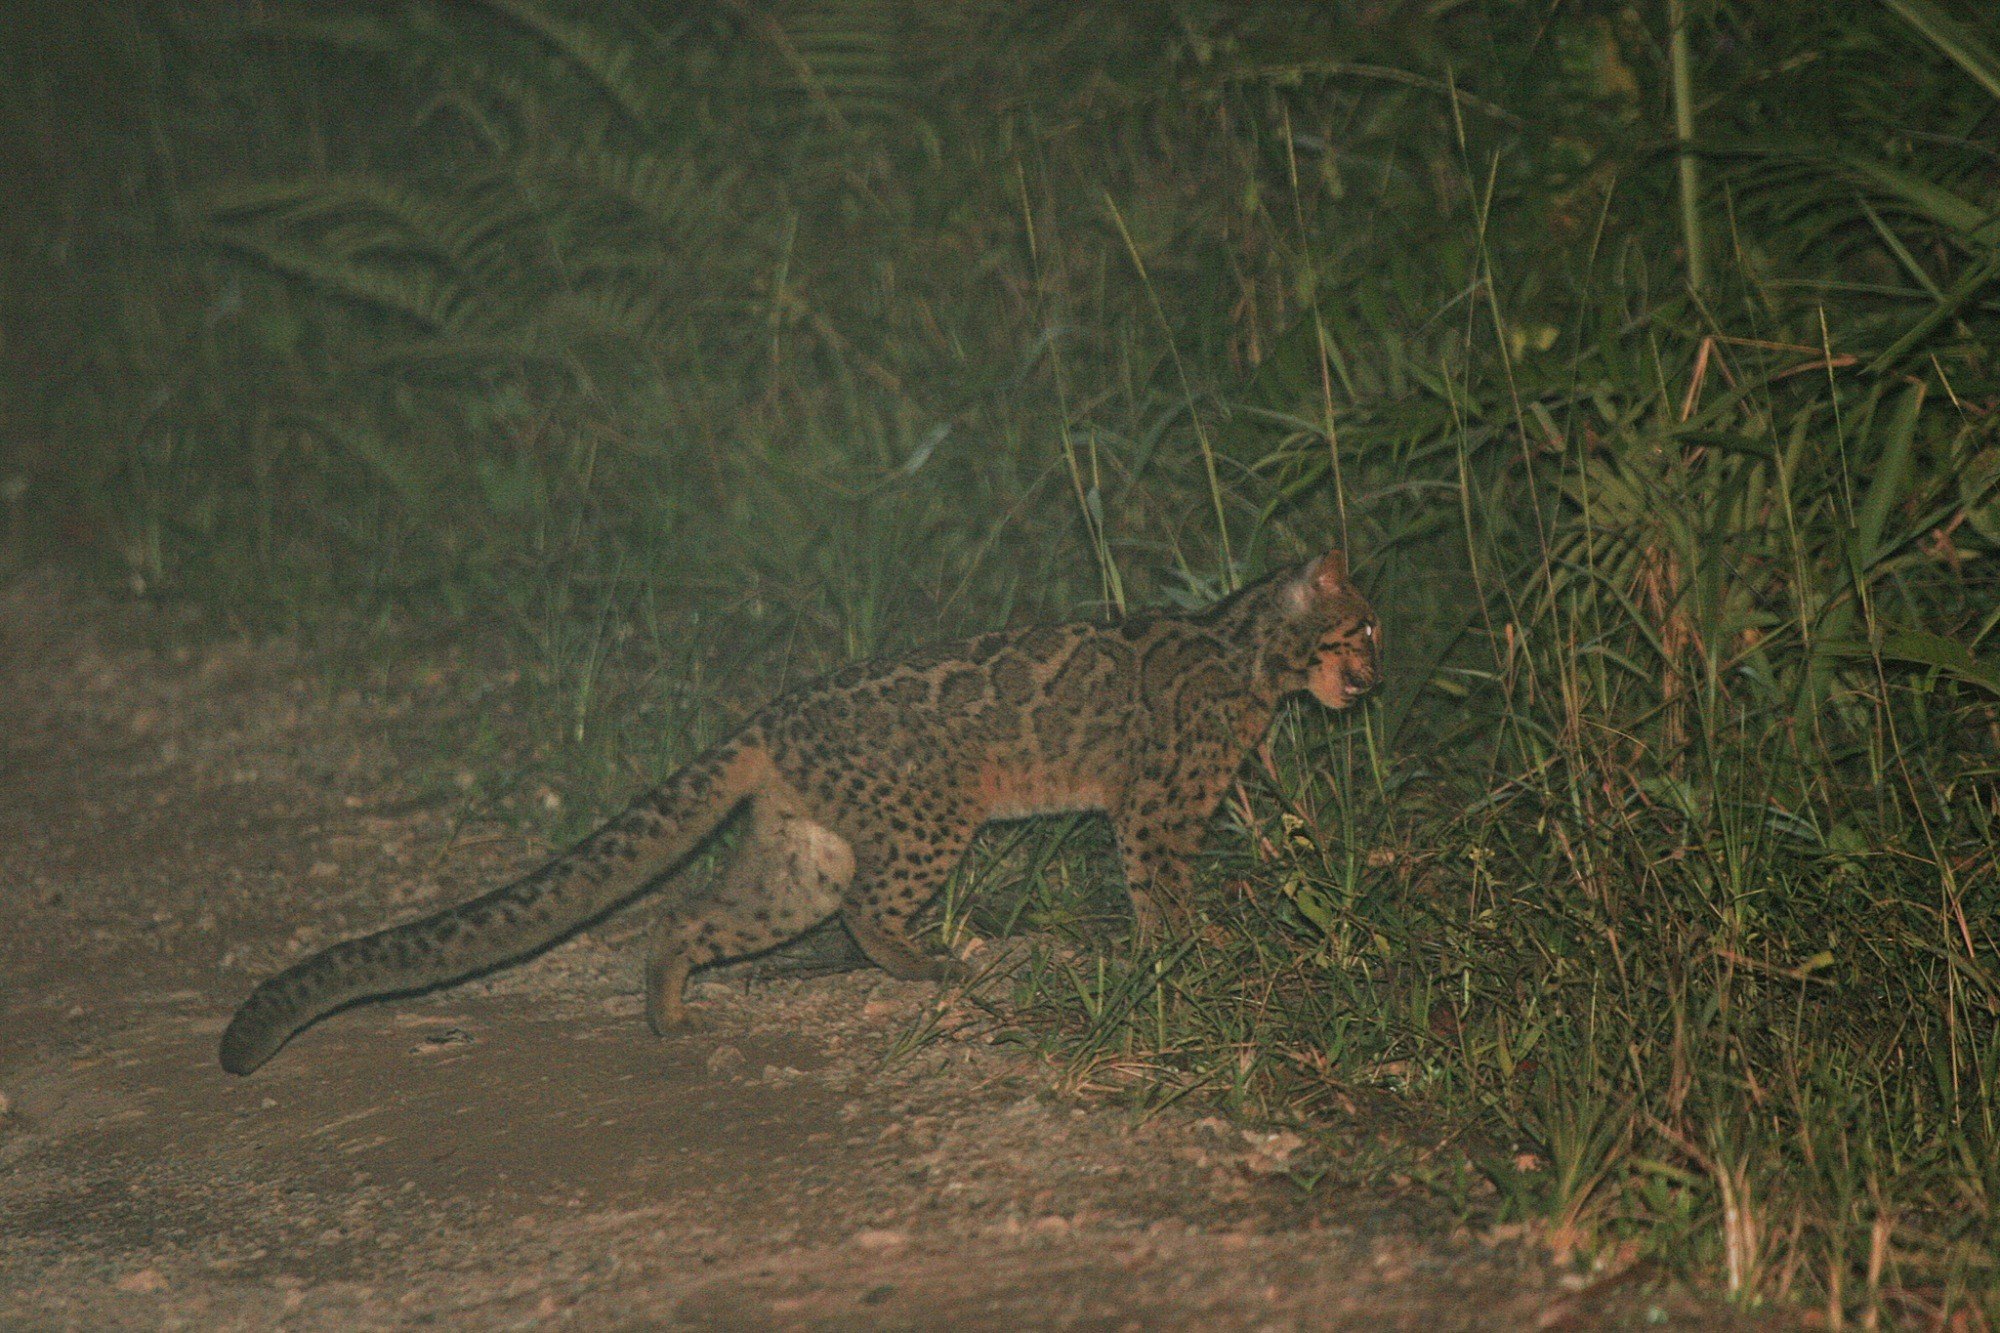
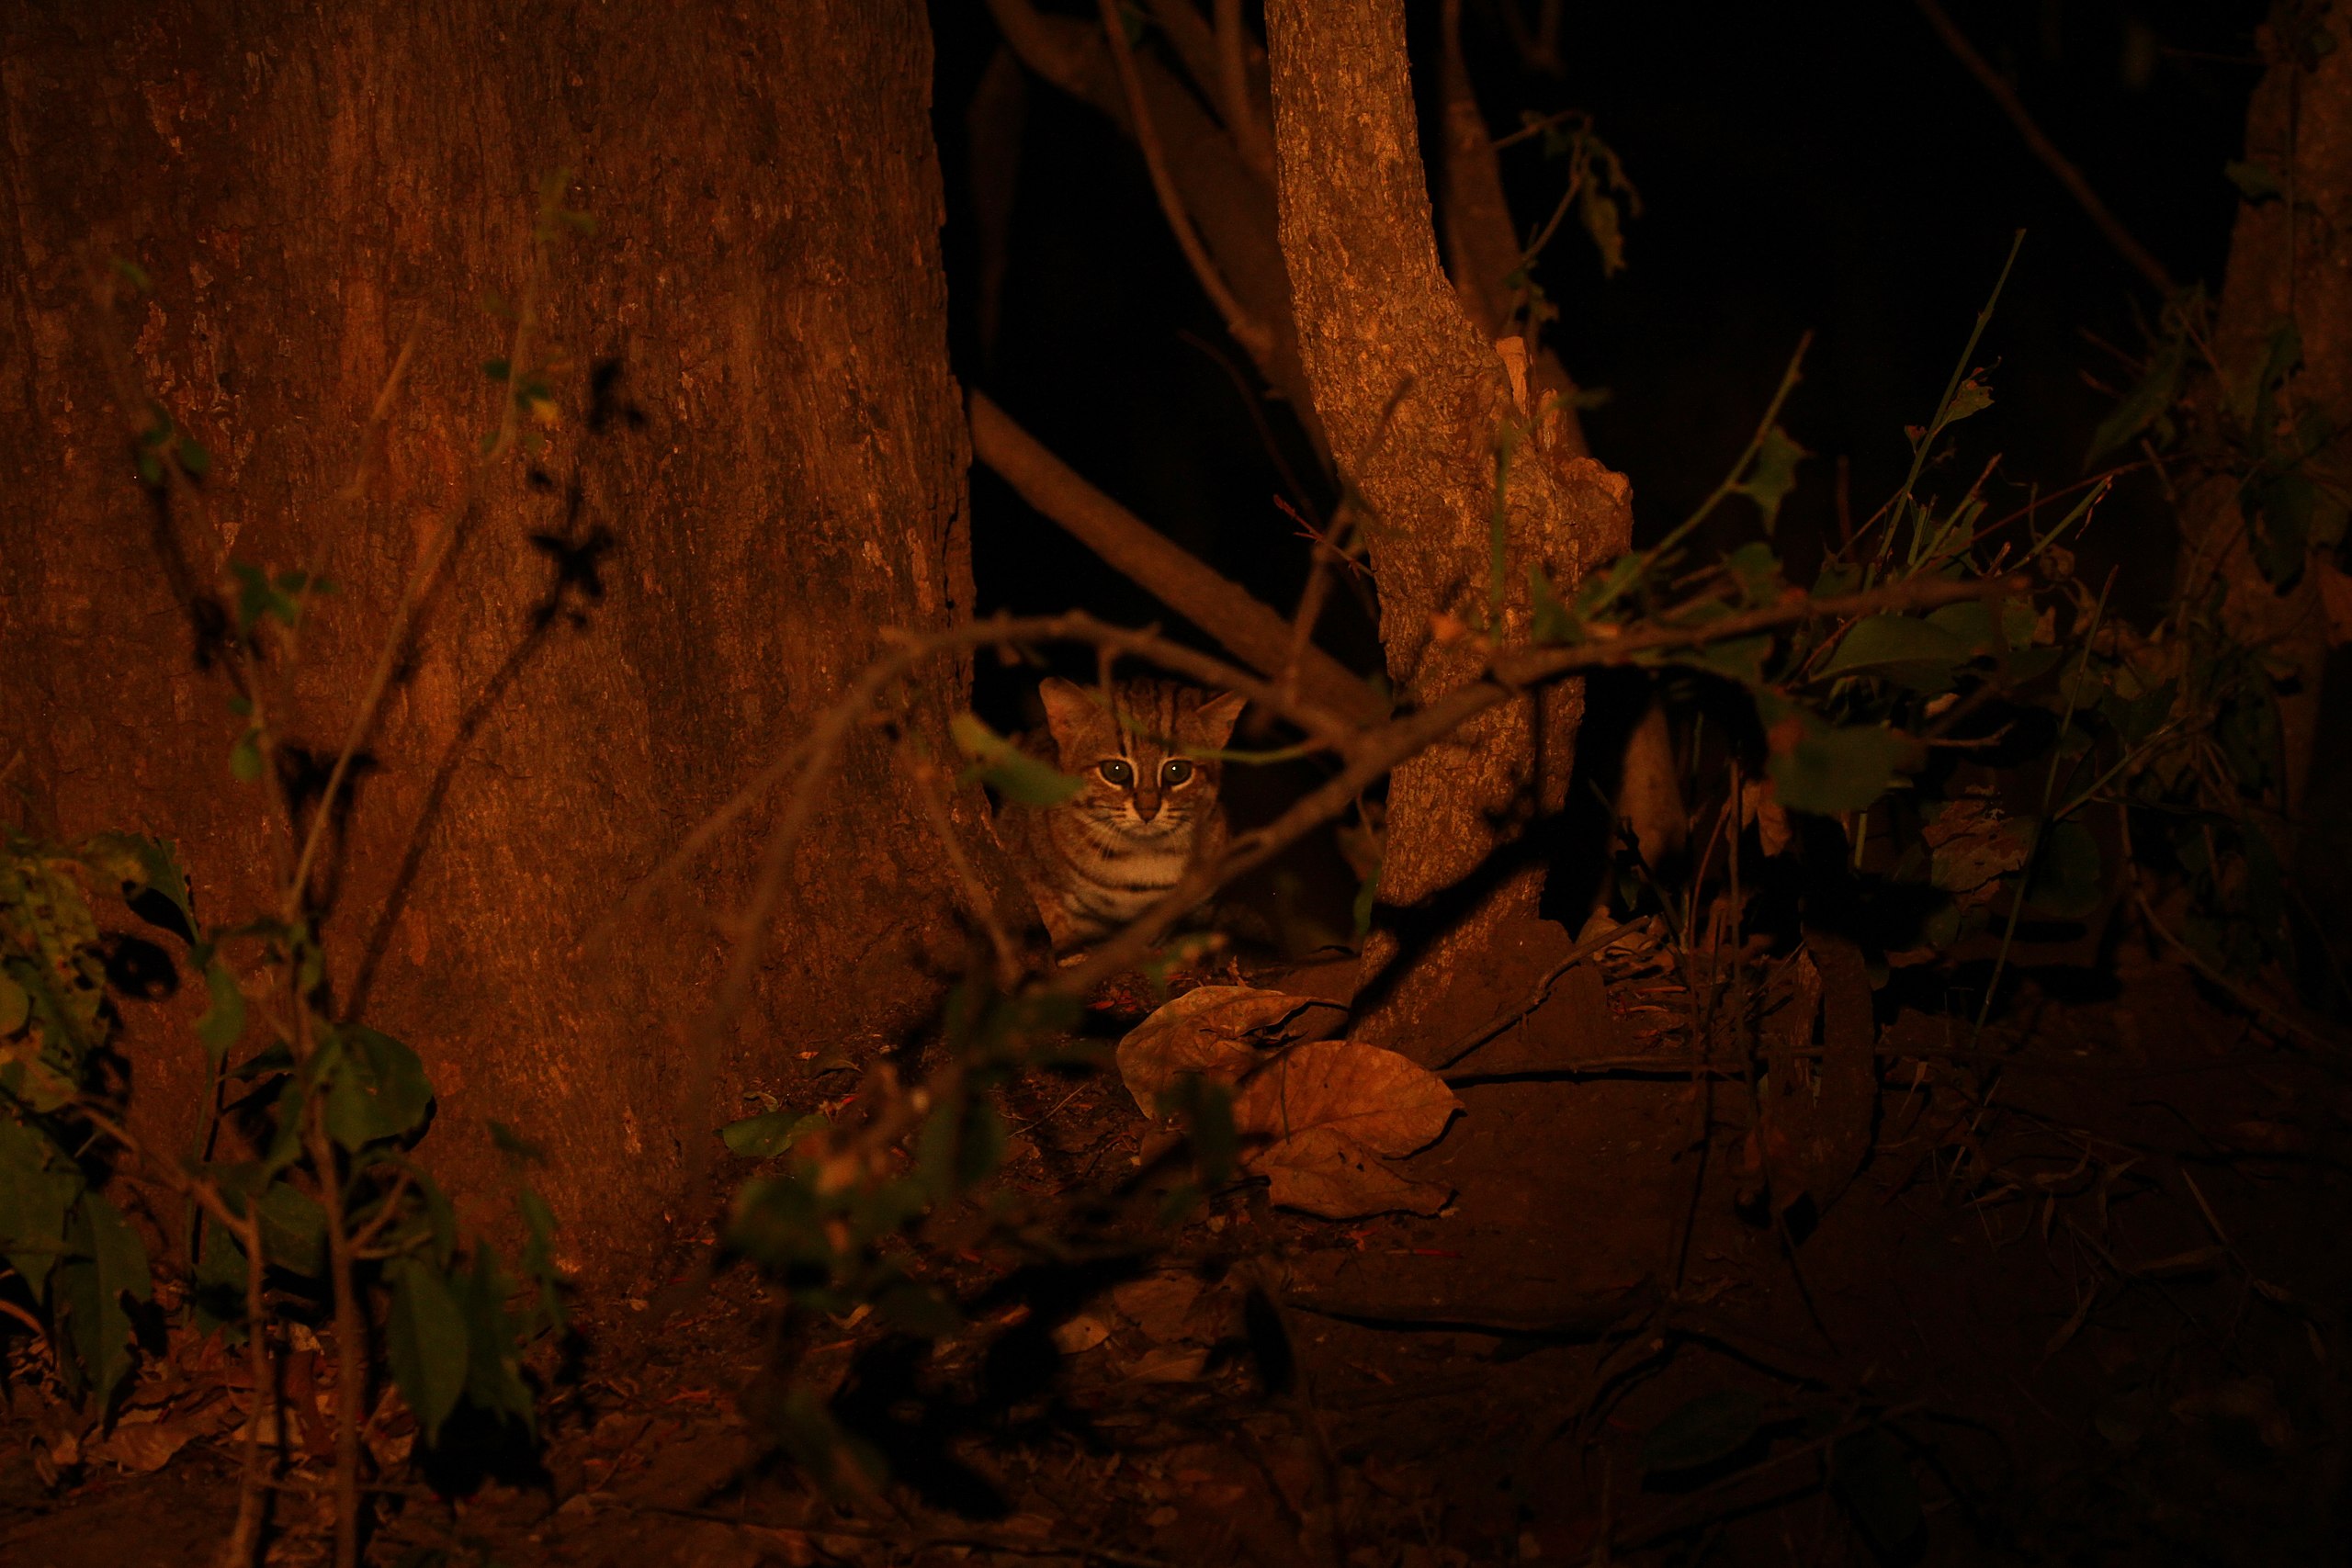
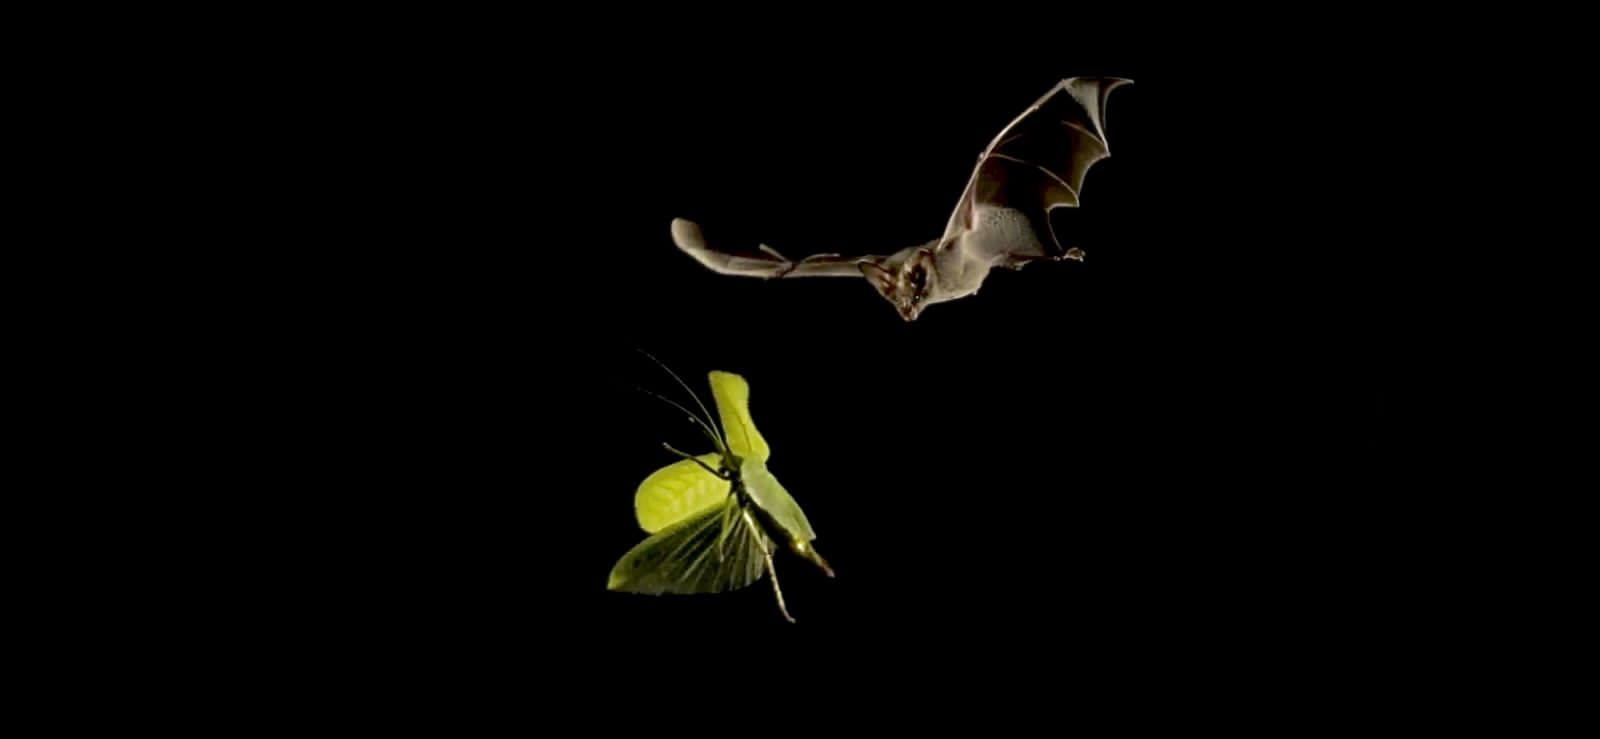
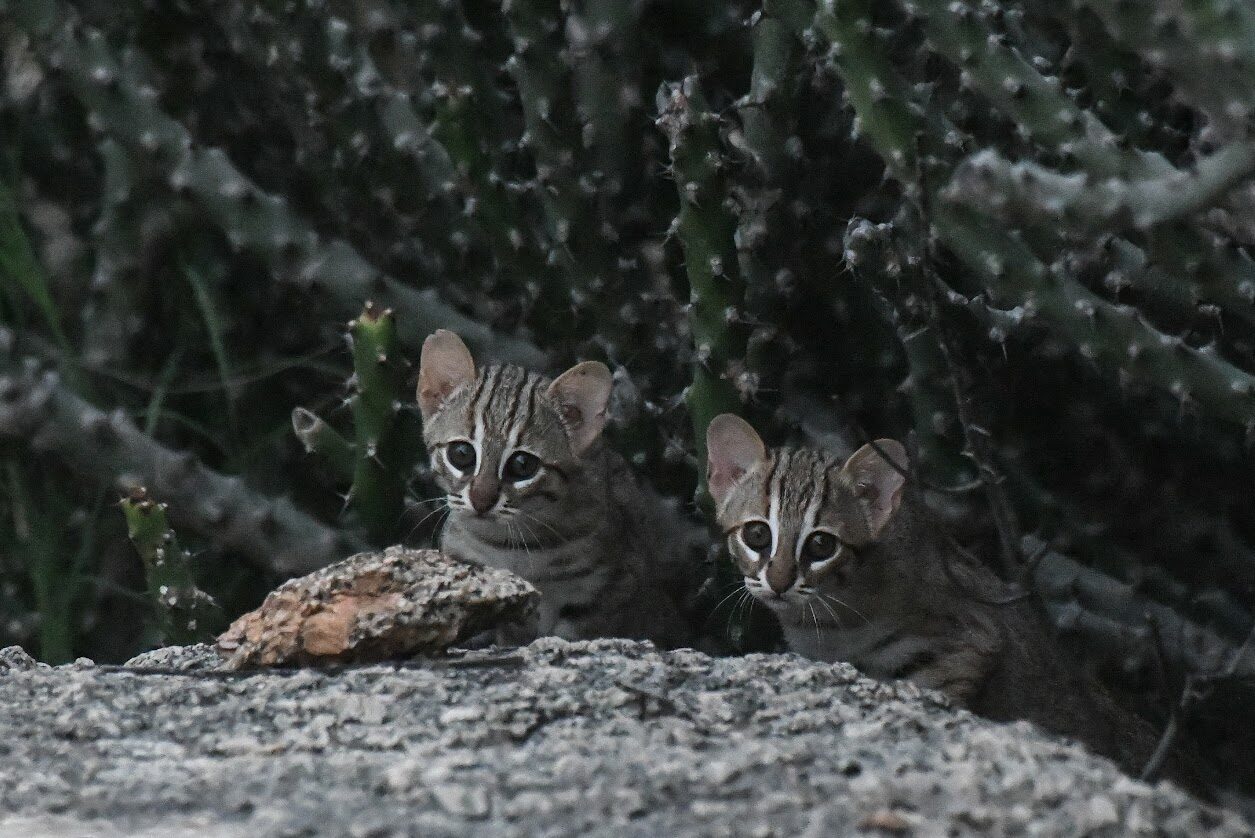
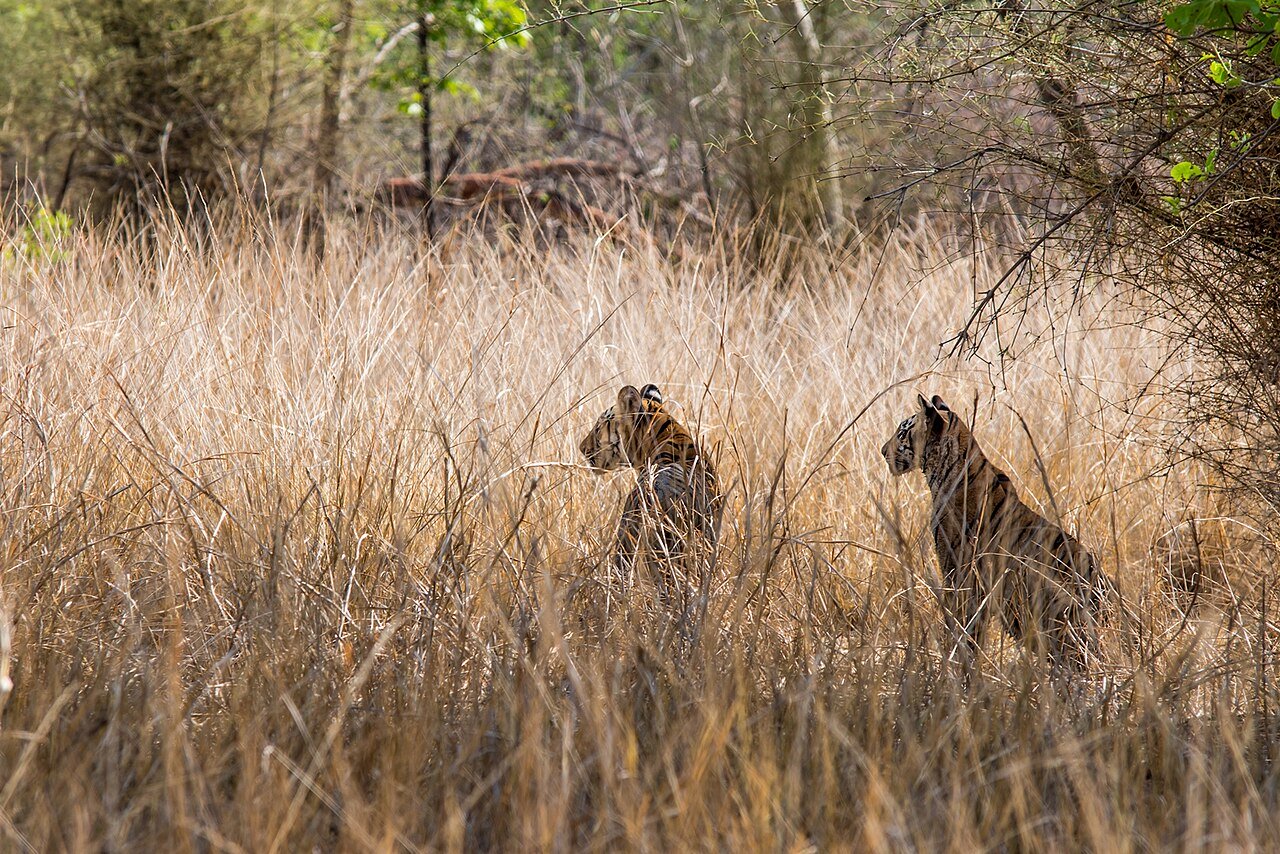
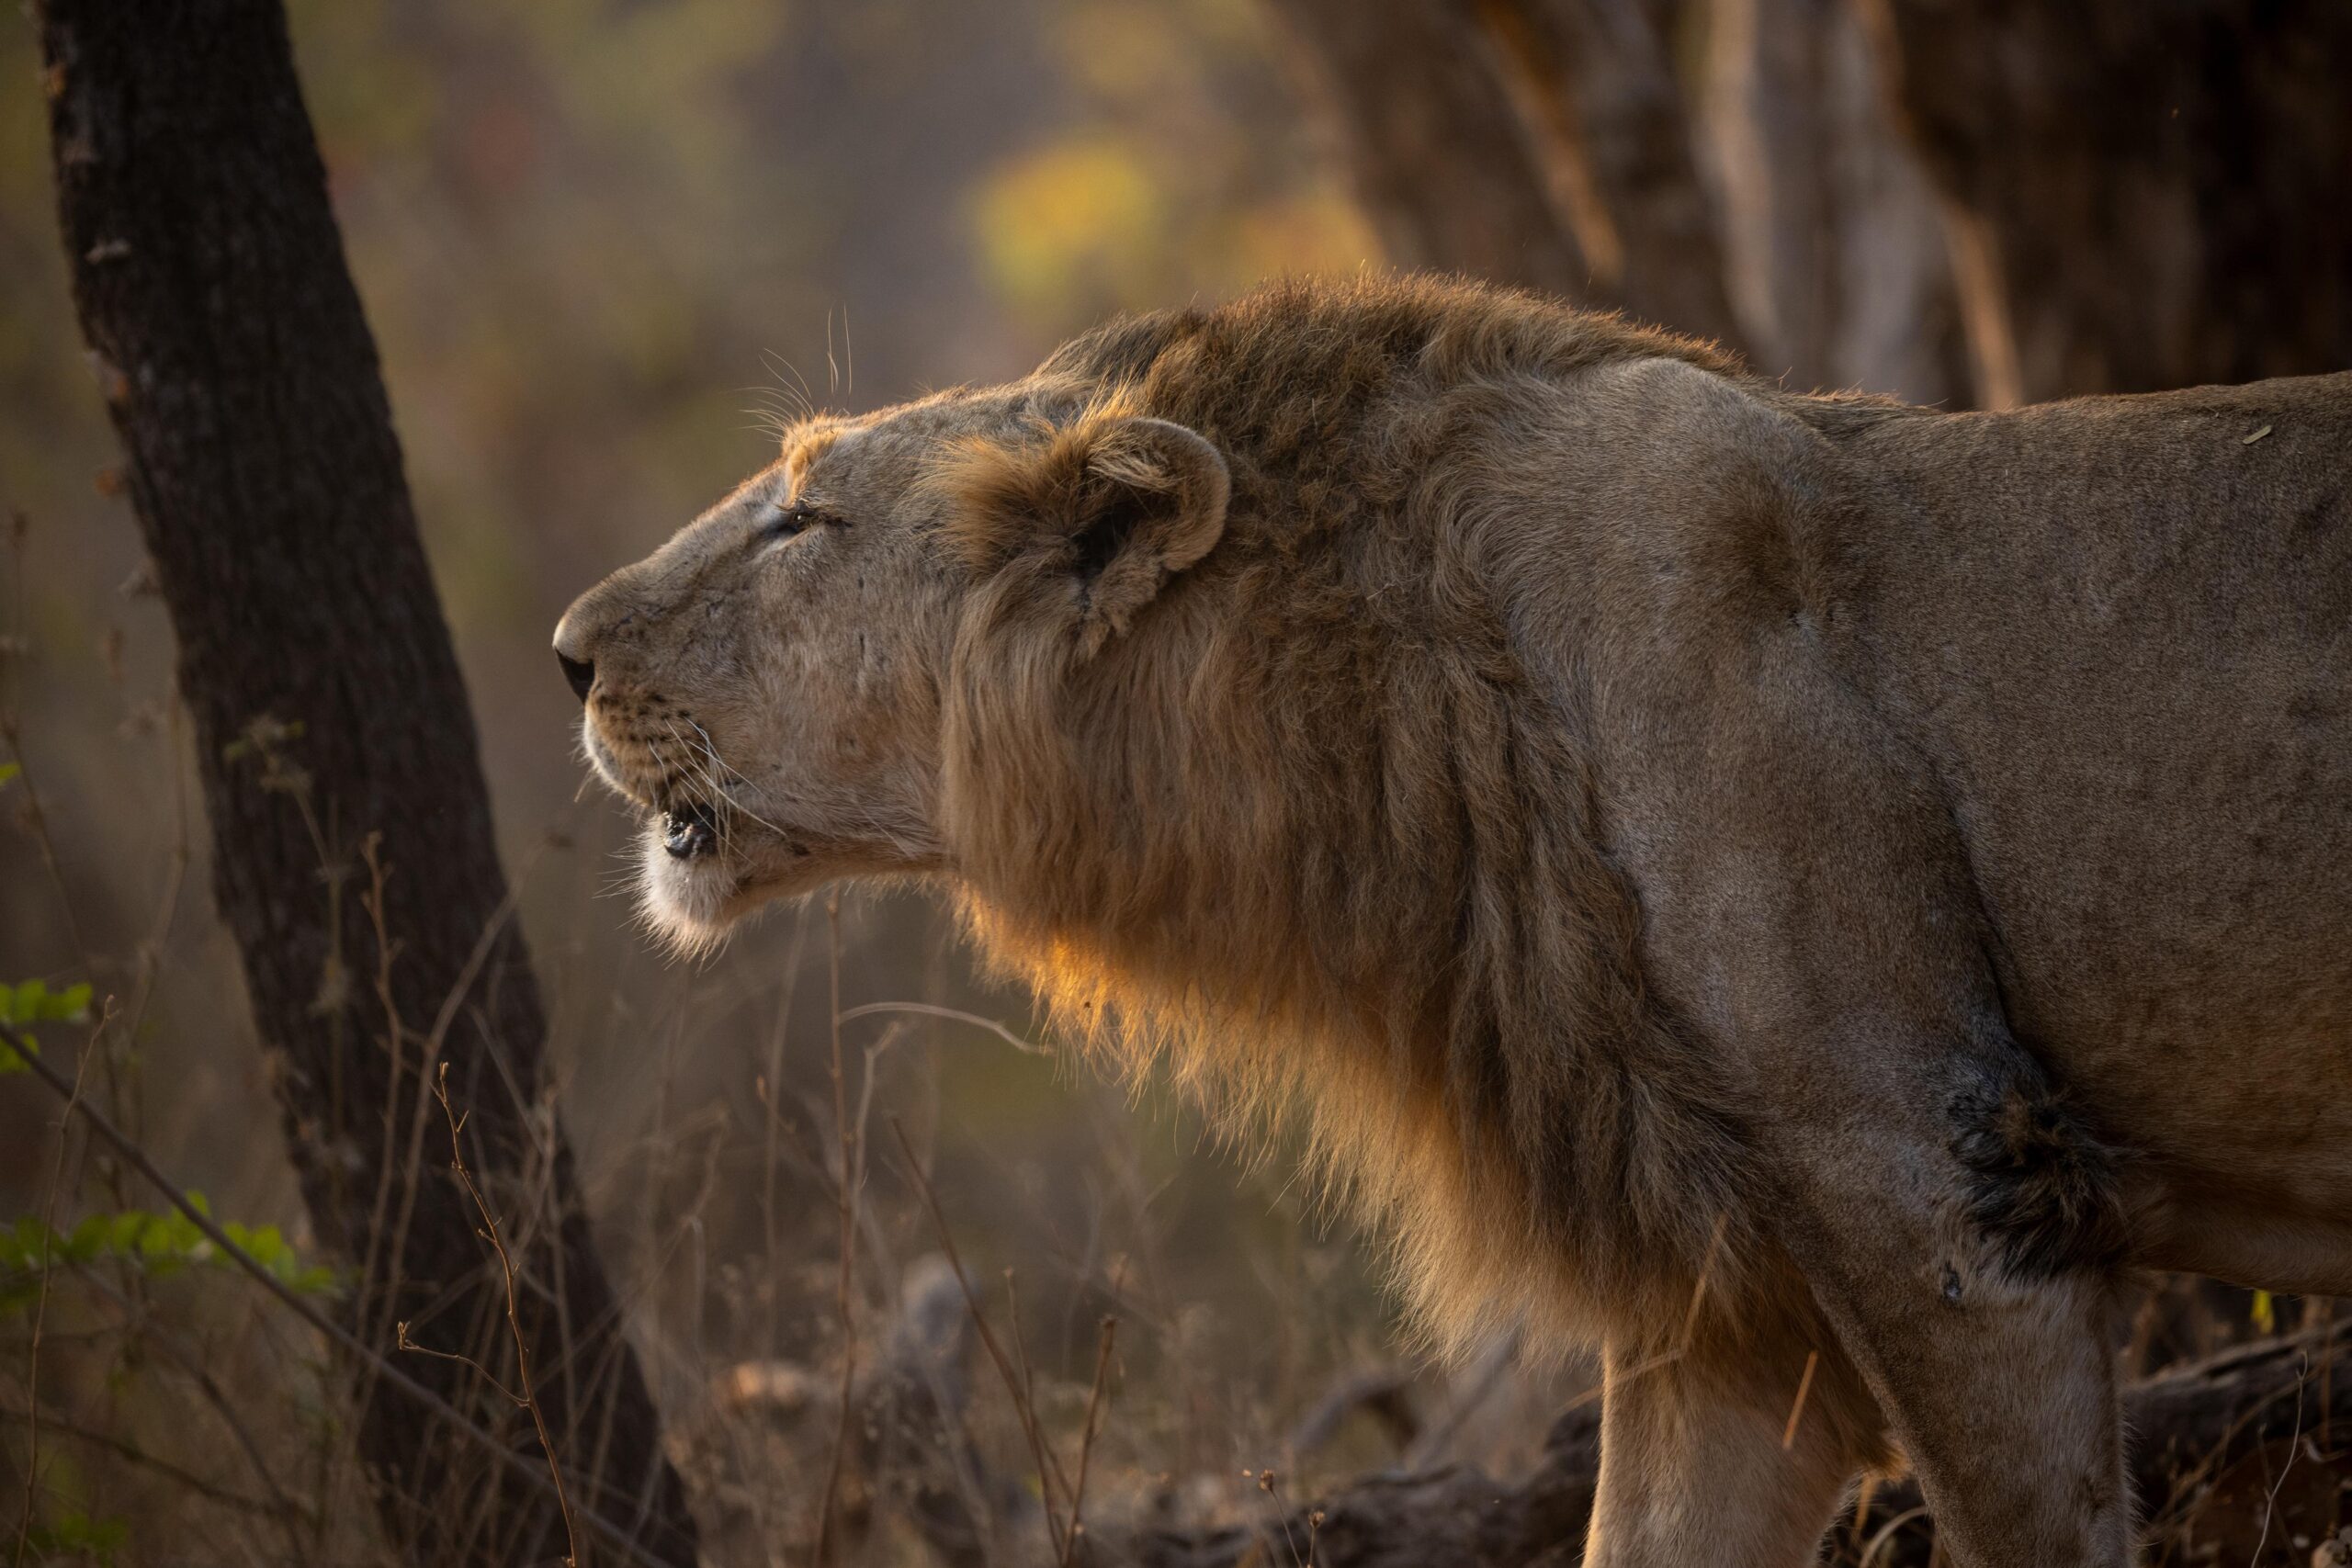
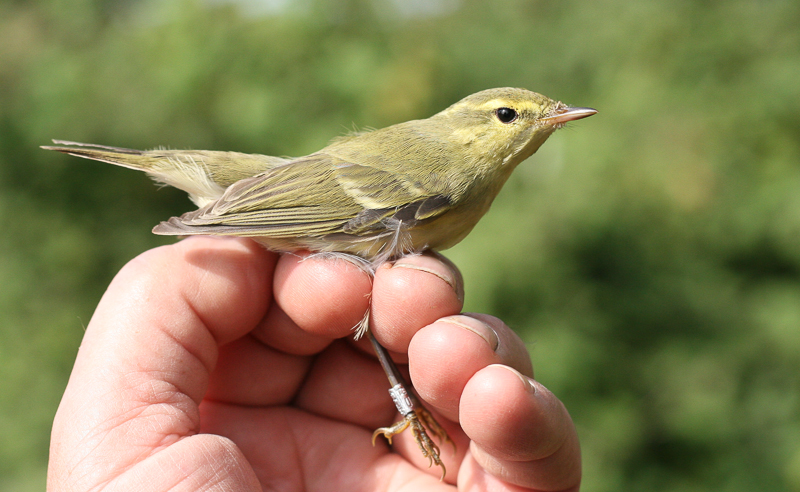
“The creation of sub-optimal habitats, when only a few trees in a region are cut down or affected, is also a crucial change. It can impact the populations of other species that inhabit the region. For example, forcing some of the animals to hunt outside the forest area, thus exposing them to various threats. These effects are not seen immediately,” he says.
Being ecologically complex, forest monitoring needs to be across multiple decades for valuable observations, Seshadri explains. “We need to invest in systems and build capacity for sustained monitoring,” he adds.
Read more: Scientist Ruth DeFries on deforestation: There isn’t one driver, there’s a different context in different places [Interview]
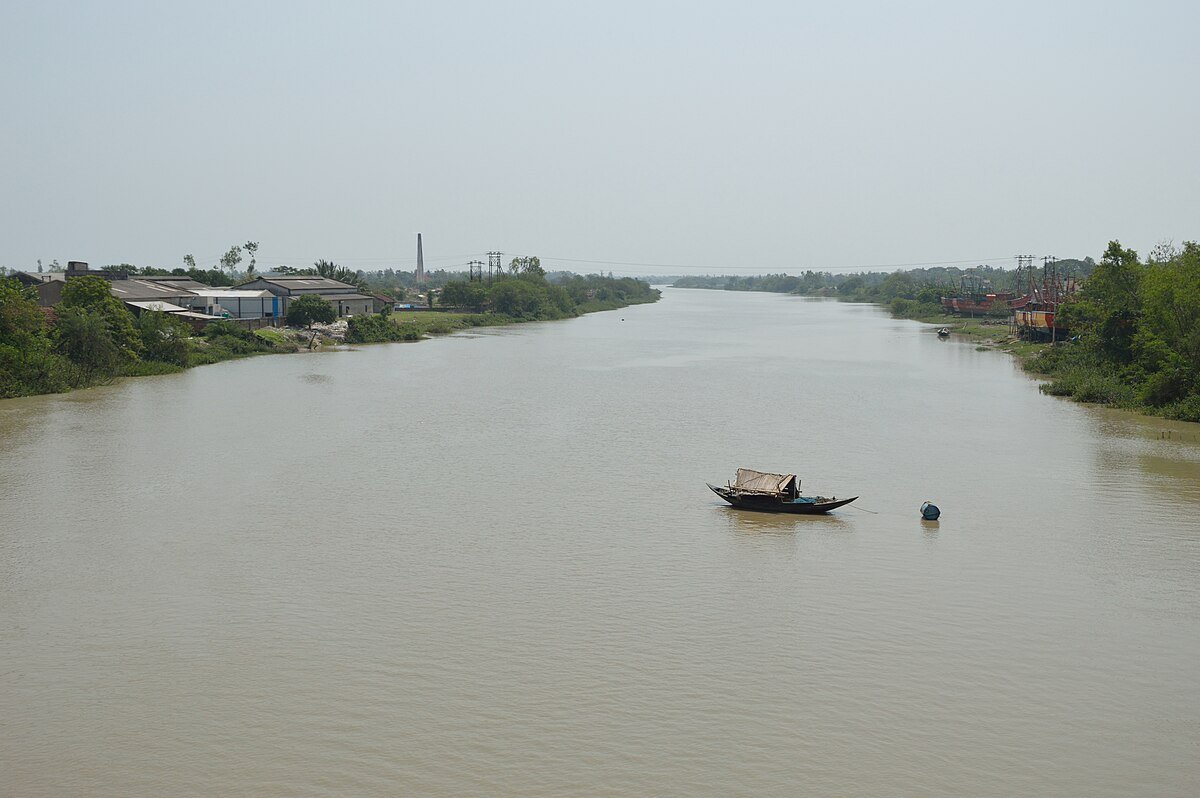
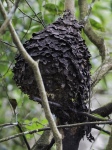
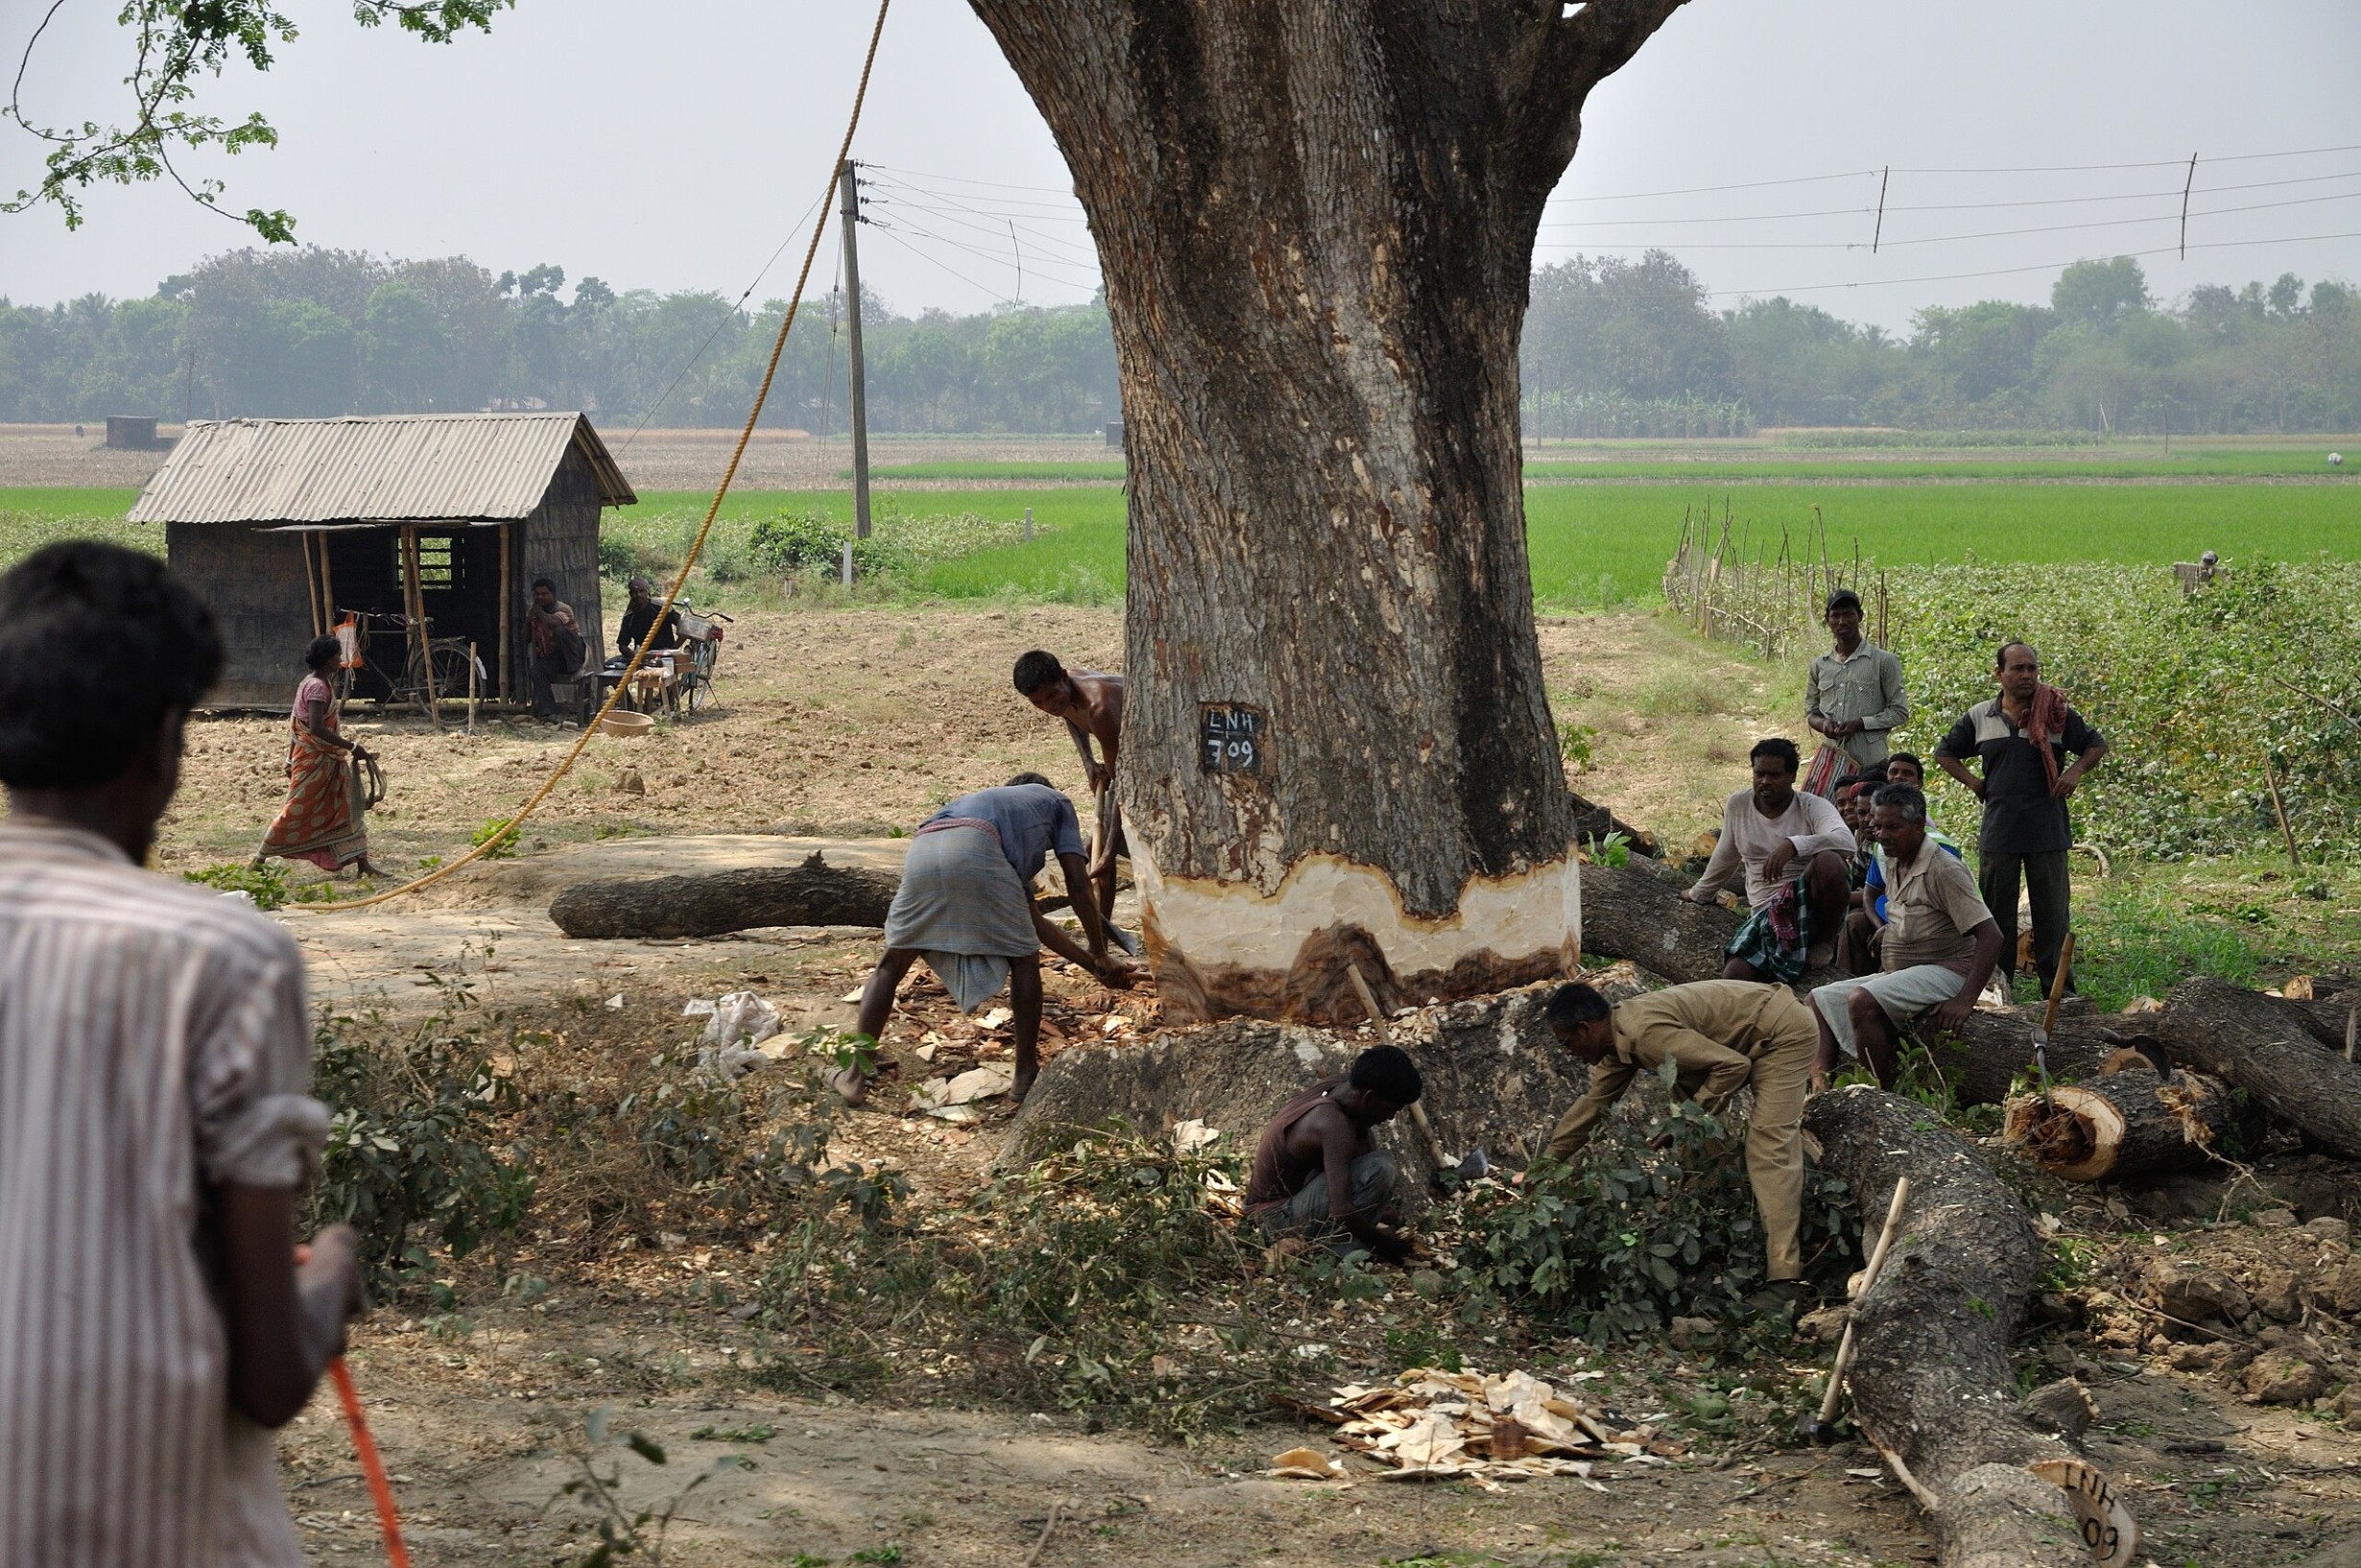
Banner image: Tree being cut in West Bengal in 2013. Image by Biswarup Ganguly via Wikimedia Commons (CC BY 3.0).